


Page 9 of 16
Statistics Tool
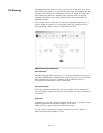
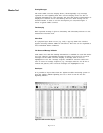
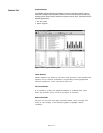
Graphical Statistics
User-definable graphical statistics are available in real-time or postcapture modes. There are
several SS7 message transfer part (MTP) statistics, as well as user part specific statistics (e.g.,
message types or release causes). Statistics are typically counts or ratios. The statistics may be
displayed graphically as:
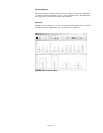
• 2D Bar charts
• Radar diagram
Figure 7: Shows a typical statistics graph.
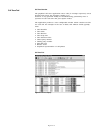
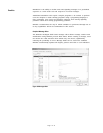
Tabular Statistics
Tabular statistics are drawn by call traces. This provides a more detailed and
dynamic view of network performance, incorporating several programmed
measures (handovers, errors, call success rates etc).
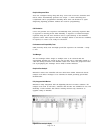
Time-based Statistics
It is possible to produce the graphical statistics as a tabular time series,
where the intervals can be set from one minute to 24 hours.
Statistics Thresholds
The user can set lower and upper thresholds which, when exceeded, will
result in color changes to the statistical graphs to highlight ‘‘alarm’’
conditions.