


990-7031C, Revision 4 12/99
10
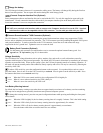
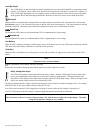
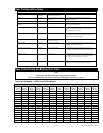
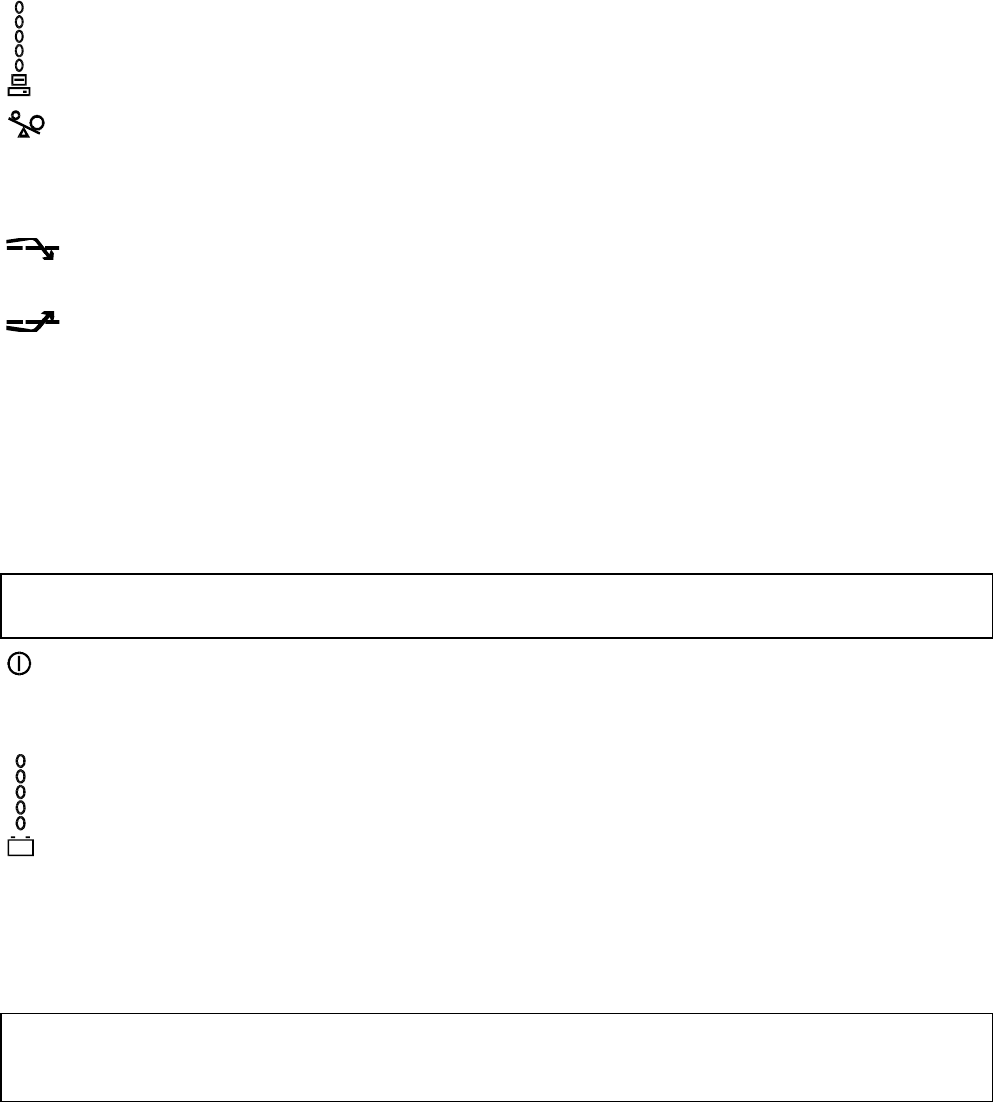
Load Bar Graph
85%
67%
50%
33%
17%
The 5-LED display on the left of the front panel represents the power drawn from the UPS as a percentage of total
capacity. For example, if three LEDs are lit, the load is drawing between 50% and 67% of the UPS’s capacity. If
all five LEDs light, thoroughly test your complete system to make sure that the UPS will not become overloaded.
In the graph to the left the load capacity threshold is listed next to the LED (values are not listed on the UPS).
Overload
When the UPS is overloaded (the connected loads exceed the maximum specified in the “maximum load” section under
Specifications, page 17), the overload LED comes on and the UPS emits a sustained tone. The alarm remains on until the
overload is removed. Disconnect nonessential load equipment from the UPS to eliminate the overload.
SmartTrim
The SmartTrim LED comes on to indicate that the UPS is compensating for a high voltage.
SmartBoost
The SmartBoost LED comes on to indicate that the UPS is compensating for a low voltage.
Low Battery
When the UPS is operating on-battery and the energy reserve of the battery runs low, the UPS beeps continuously until the
UPS shuts down from battery exhaustion or returns to on-line operation.
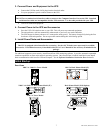
Cold Start
When the UPS is off and there is no utility power, use the cold start feature to apply power to the loads from the UPS’s
battery.
Note:
Cold start is not a normal condition.
Press and hold the on/test button until the UPS beeps.
Release the on/test button during the beep and the loads are powered within four seconds.
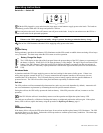
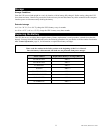
The display indicates that the voltage is between the displayed value from the list and the next higher value. For example,
with three LEDs lit, the input voltage is between 208 and 223 VAC.
If no LEDs come on and the UPS is plugged into a working AC power outlet, the line voltage is extremely low.
If all five LEDs come on, the line voltage is extremely high and should be checked by an electrician.
Note:
The UPS starts a self-test as a part of this procedure. The self-test does not affect the voltage display. The utility
voltage bar graph has a margin of error of ±
±±
± 4%.
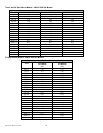
239
223
208
193
177
Utility Voltage Bar Graph
This UPS has a diagnostic feature that displays the utility voltage. With the UPS plugged into the normal utility
power, press and hold the on/test button to see the utility voltage bar graph display. After approximately four
seconds the 5-LED display on the right of the front panel shows the utility input voltage. Refer to the figure to the
left for the voltage reading (values are not listed on the UPS).