Page 19
5.0 Operation
5.2 Battery capacity bar graph
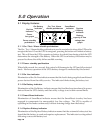
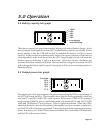
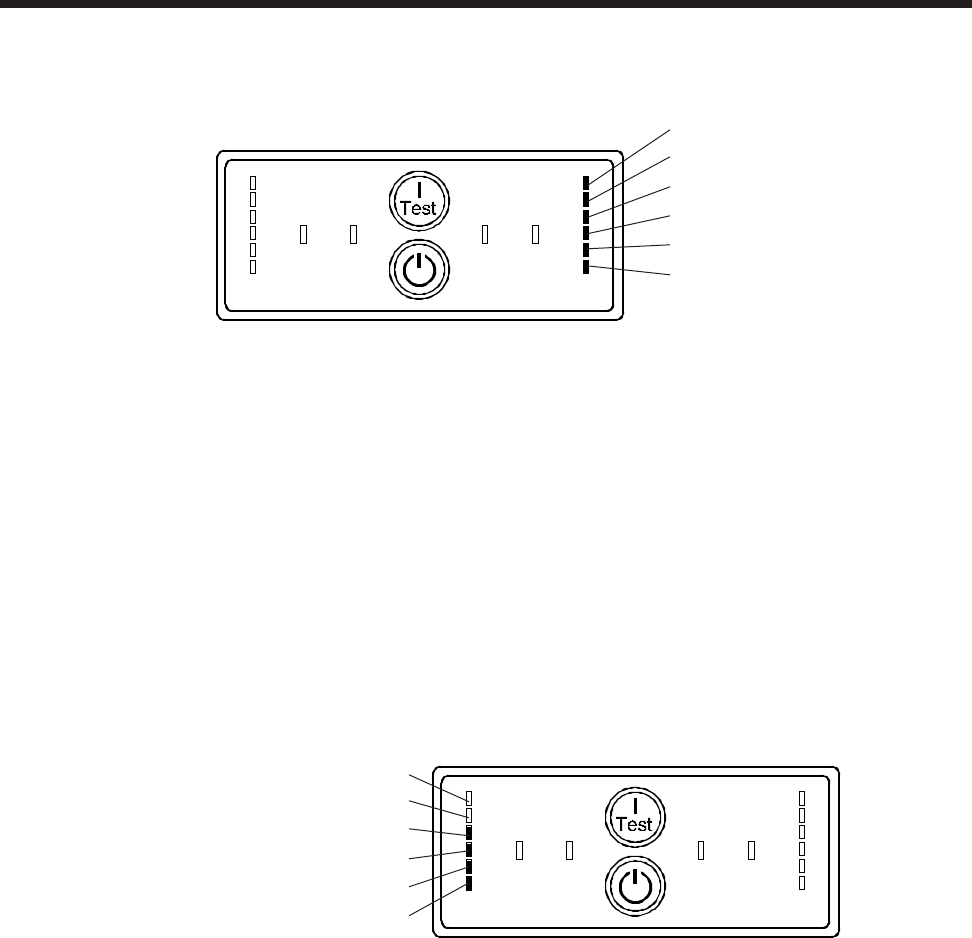
The battery capacity bar graph continuously displays the state of battery charge. In the
above example, the display shows that 100% of rated battery capacity is available. Where
power quality is fair, the UPS will be able to maintain the battery at 100% of rated
capacity. In the event of an extended utility failure, the capacity shown will decrease at
a rate dependent on the load drawn from the UPS. Large computer loads will cause the
battery capacity indication to fall at a faster rate. When low battery conditions are
reached, the bottom-most bar will blink. Once normal line voltages are restored, the UPS
will recharge the battery and the capacity bar graph will show an increasing number of
illuminated bars.
5.3 Output power bar graph
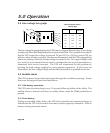
The output power bar graph displays the power drawn from the UPS as a percentage of
the UPS's full rated capacity. This example shows that the load equipment is drawing
between 67% and 85% of the UPS's rated capacity. If this were a 1250VA UPS running a
computer load, then the above would correspond to between 840 VA and 1060 VA (590
Watts and 740 Watts at 0.7 power factor). This is a typical installation. When the UPS is
loaded such that five bars are illuminated, thoroughly test your complete system to be
sure the UPS will not become overloaded. A thorough test includes running backup tape
drives, disk drives, etc. If the UPS becomes overloaded, the overload bar will illuminate
and the UPS will sound an alarm.
100%
80%
60%
40%
20%
Low battery
when blinking
Overload
85%
67%
50%
33%
17%


