46Metered Rack PDU User Guide
About the Home Tab
Use the Home tab to view active alarms, the load status of the Rack PDU, and the most recent Rack
PDU events.
The Overview view
Path: Home > Overview
The top of the Overview indicates the alarm status. If one or more alarms are present, the number and
type of alarms are indicated with a link to the Alarm Status view, where you can view descriptions of
each alarm. If no alarms exist, the Overview displays, “No Alarms Present.”
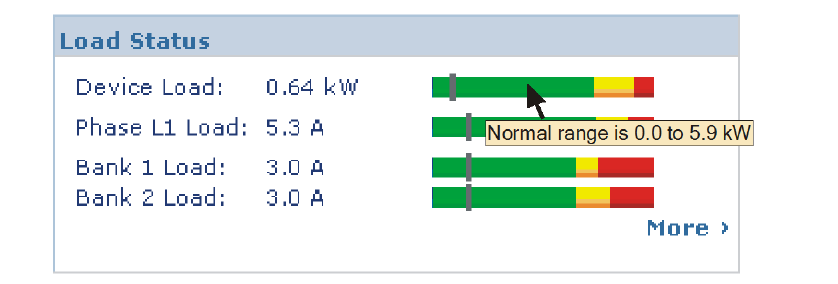
In the Load Status area, view the load for the device in kW and for the phases and banks in amps, as
applicable. The green, yellow, and red meter shows the current load status: normal, near overload, or
overload. Note that if a low load threshold was configured the meter will also include a blue segment to
the left of the green. Hover over the colors to view the configured load thresholds.
Click More to go to the Device Manager tab to configure thresholds and to view and manage peak load
information.
In the device parameters area, view the name, contact, location, current rating, type of user account
accessing the Rack PDU, and the amount of time the Rack PDU has been operating since the last reboot
from either a power cycle or a reboot of the Management Interface. [For more information, see “Reset
the Rack PDU” on page 78.]
In the Recent Device Events area, view, in reverse chronological order, the events that occurred most
recently and the dates and times they occurred. A maximum of five events are shown at one time. Click
More Events to go to the Logs tab to view the entire event log.
The Alarm Status view
Path: Home > Alarm Status
The Alarm Status view provides a description of all alarms present. For details about a temperature or
humidity threshold violation, click the Environment tab.
