12 MergePoint 5224/5240 Service Processor Manager User Guide
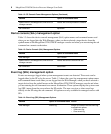
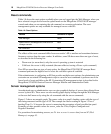
Table 1.10 shows the sensor management options available when you are logged into the Web
Manager, when you have selected a target device from the spshell menu on the MergePoint 5224/
5240 SP manager console and when you are entering the ssh command on a remote workstation.
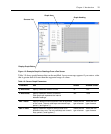
The sensor options display unformatted sensor data collected from the server by its SP. The page
that appears provides a button that when clicked displays graphs of data from individual sensors.
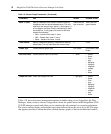
Mean Y Value Specify a different mean value to use as a basis for
comparison with the actual detected value. The only
valid keys are numeric keys, period (.) and hyphen (-).
In line graphs, the Mean Temp is indicated by a black
horizontal line. In bar graphs, the colors of the bars
indicate the following:
• Blue – Less than the mean Y value.
• Red – Greater than mean Y value.
• Black – Equal to the mean Y value.
Varies with the
type of sensor
Varies with the
type of sensor
Time Interval Specify a different frequency in seconds for fetching
sensor data. The only valid keys are numeric keys.
55-300
Graph Type Choose another graph type. Line Graph Line Graph or Bar
Graph
Grid Line Color Choose another color for the lines. • white • yellow
• green
•cyan
•gray
• darkgray
• lightgray
• magenta
• orange
•pink
•white
Graph BG Color Select the background color. • light gray • yellow
• green
•cyan
•gray
• darkgray
• lightgray
• magenta
• orange
•pink
•white
Table 1.9: Sensor Graph Parameters (Continued)
Field/Menu Use Default Allowed Values


