


724-746-5500 | blackbox.com
Page 44
724-746-5500 | blackbox.com
Chapter 3: Configuration
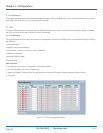
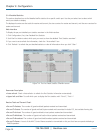
3.1.4 Detailed Statistics
This section describes how to find detailed traffic statistics for a specific switch port. Use the port select box to select which
switch port details to display.
The displayed counters are the totals for receive and transmit, the size counters for receive and transmit, and the error counters for
receive and transmit.
Web Interface
To Display the per port detailed port statistics overview in the Web interface:
1. Click Configuration, Port, then Detailed Port Statistics
2. Scroll the Port Index to select which port you want to show the detailed “Port Statistics overview” .
3. If you want to auto-refresh the information, check the “Auto-refresh” box.
4. Click “Refresh“ to refresh the port detailed statistics or clear all information when you click “Clear”.
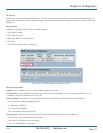
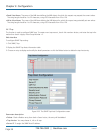
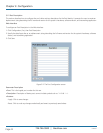
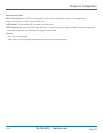
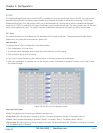
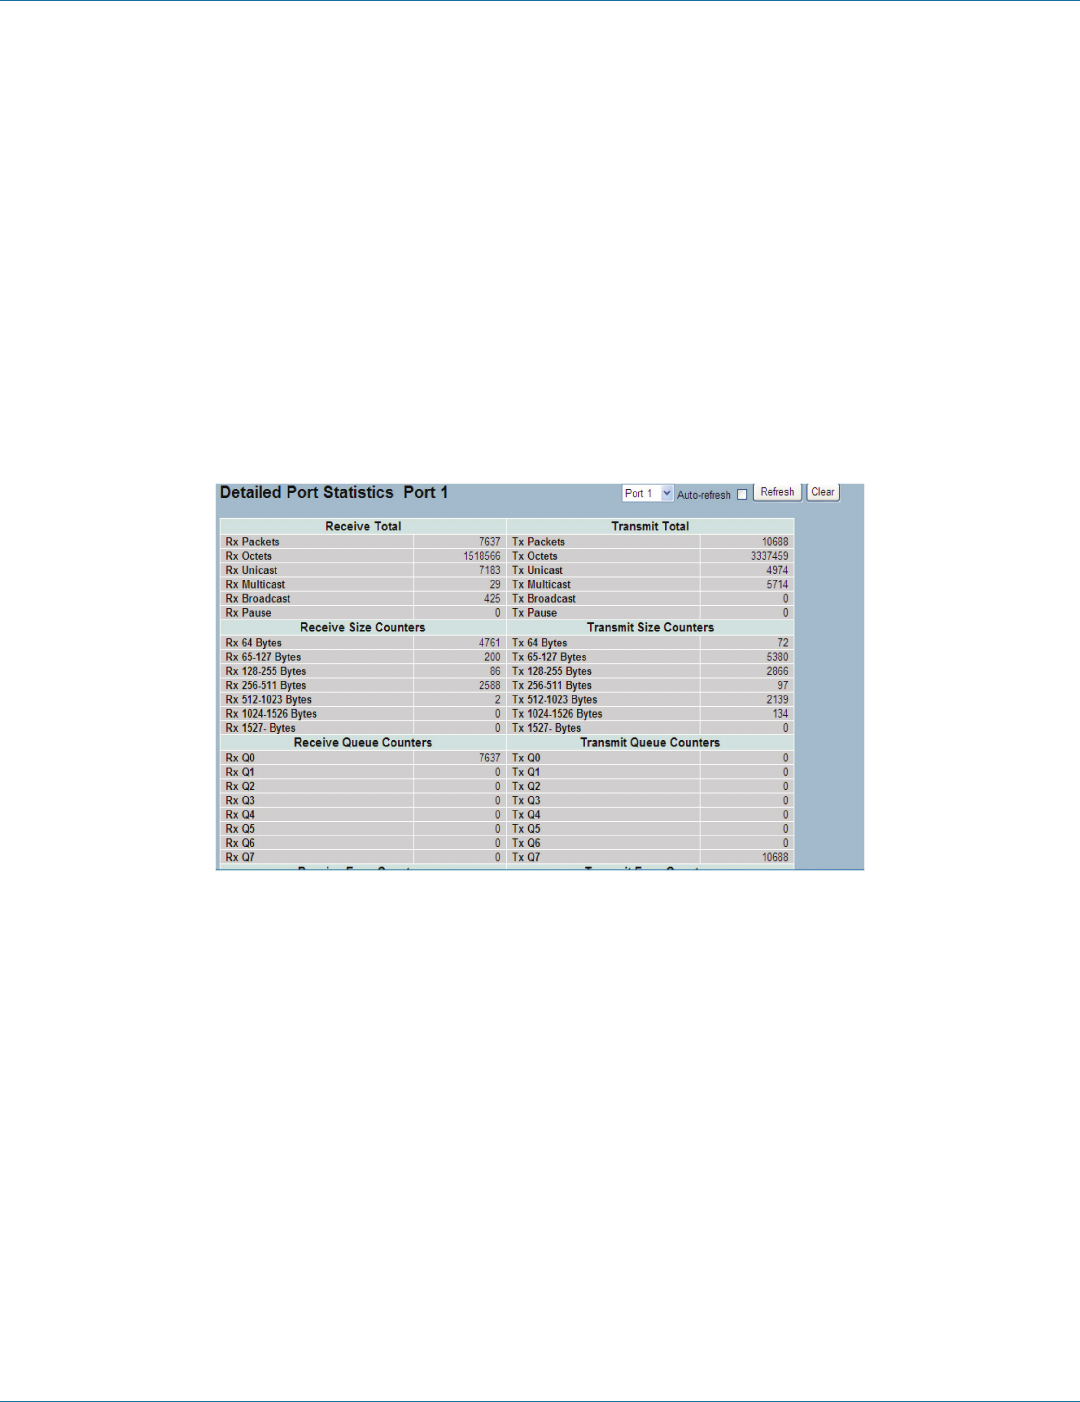
Figure 3-4. The Port Detail Statistics Overview screen.
Parameter Description
• Auto-refresh: Check <Auto-refresh> to refresh the Port Statistics information automatically.
• Upper left scroll bar: To scroll which port to display the Port statistics with “Port-0”, “Port-1...“
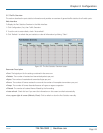
Receive Total and Transmit Total:
• Rx and Tx Packets: The number of (good and bad) packets received and transmitted.
• Rx and Tx Octets: The number of (good and bad) bytes received and transmitted. Includes FCS, but excludes framing bits.
• Rx and Tx Unicast: The number of (good and bad) unicast packets received and transmitted.
• Rx and Tx Multicast: The number of (good and bad) multicast packets received and transmitted.
• Rx and Tx Broadcast: The number of (good and bad) broadcast packets received and transmitted.
• Rx and Tx Pause: A count of the MAC Control frames received or transmitted on this port that have an opcode indicating a
PAUSE operation.
LGB1108A