


24-7
Cisco ASA Series Firewall CLI Configuration Guide
Chapter 24 Troubleshooting Connections and Resources
Monitoring Per-Process CPU Usage
Determining Packet Routing with Traceroute
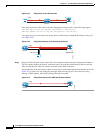
You can trace the route of a packet using the traceroute feature, which is accessed with the traceroute
command. A traceroute works by sending UDP packets to a destination on an invalid port. Because the
port is not valid, the routers along the way to the destination respond with an ICMP Time Exceeded
Message, and report that error to the ASA.
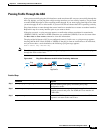
Tracing Packets with Packet Tracer
The packet tracer tool provides packet tracing for packet sniffing and network fault isolation, as well as
detailed information about the packets and how they are processed by the ASA. If a configuration
command did not cause the packet to drop, the packet tracer tool can provide information about the cause
in an easily readable format.
In addition, you can trace the lifespan of a packet through the ASA to see whether the packet is operating
correctly with the packet tracer tool. This tool enables you to do the following:
• Debug all packet drops in a production network.
• Verify the configuration is working as intended.
• Show all rules applicable to a packet, along with the CLI commands that caused the rule addition.
• Show a time line of packet changes in a data path.
• Inject tracer packets into the data path.
• Search for an IPv4 or IPv6 address based on the user identity and the FQDN.
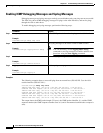
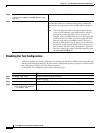
To trace packets, enter the following command:
Monitoring Per-Process CPU Usage
You can monitor the processes that run on the CPU. You can obtain information about the percentage of
CPU that is used by a certain process. CPU usage statistics are sorted in descending order to display the
highest consumer at the top. Also included is information about the load on the CPU per process, at 5
seconds, 1 minute, and 5 minutes before the log time. This information is updated automatically every
5 seconds to provide real-time statistics.
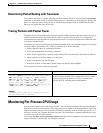
You can use the show process cpu-usage sorted command to find a breakdown of the process-related
load-to-CPU that is consumed by any configured contexts.
Command Purpose
packet-tracer input [ifc_name] [icmp [sip | user
username | fqdn fqdn-string] type code ident [dip |
fqdn fqdn-string]] | [tcp [sip | user username |
fqdn fqdn-string] sport [dip | fqdn fqdn-string]
dport] | [udp [sip | user username | fqdn fqdn-
string] sport [dip | fqdn fqdn-string] dport] |
[rawip [sip | user username | fqdn fqdn-string] [dip
| fqdn fqdn-string]] [detailed] [xml]
Example:
ciscoasa# packet-tracer input inside tcp 10.2.25.3
www 209.165.202.158 aol detailed
Provides detailed information about the packets and how they
are processed by the ASA. The example shows how to enable
packet tracing from inside host 10.2.25.3 to external host
209.165.202.158, including detailed information.