


m
ar345 Program Manual 3 3
_
____________________________________________________________________________________
_
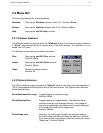
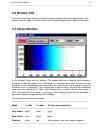
The plot area of the window shows the following features:
V
ertical axis Interpolated intensities
U
pper horizontal axis Length of line in pixel units.
L
ower horizontal axis Length of line in mm units.
L
eft dashed red line Marks the begginning of a measured distance. This line can be
moved using the left mouse button.
R
ight dashed red line Marks the begginning of a measured distance. This line can be
moved using the right mouse button.
H
orizontal red lines Shows the length of the line in pixels (mm) and the distance
between the dashed vertical lines.
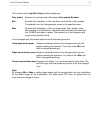
The pointer can be used to measure distances by setting the red dashed lines to the desire
d
position along the drawn line. This is particularly useful if you want to measure cell constant
s.
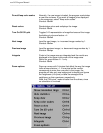
The program features a peak finding algorithm which tries to set the bars on top of the fir
st
and the last peak of the plot. In between the peaks the program then looks for other peak
s
and tries to calculate the best inter−peak distances by assuming a harmonic oscillation. Th
e
no. of peaks calculated by the program is displayed in the "No. of peaks" text field. Of course
,
this value may be modified. The derived cell constants do not take into account any particula
r
setting or symmetry of the crystal but calculates cell constants assuming plain orthogon
al
axes in reciprocal space.