


MCE User’s Guide MCE windows and dialogs
NM20600A-A 2004-05-17 29
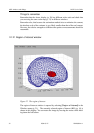
12.7 Color display
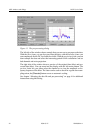
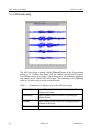
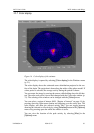
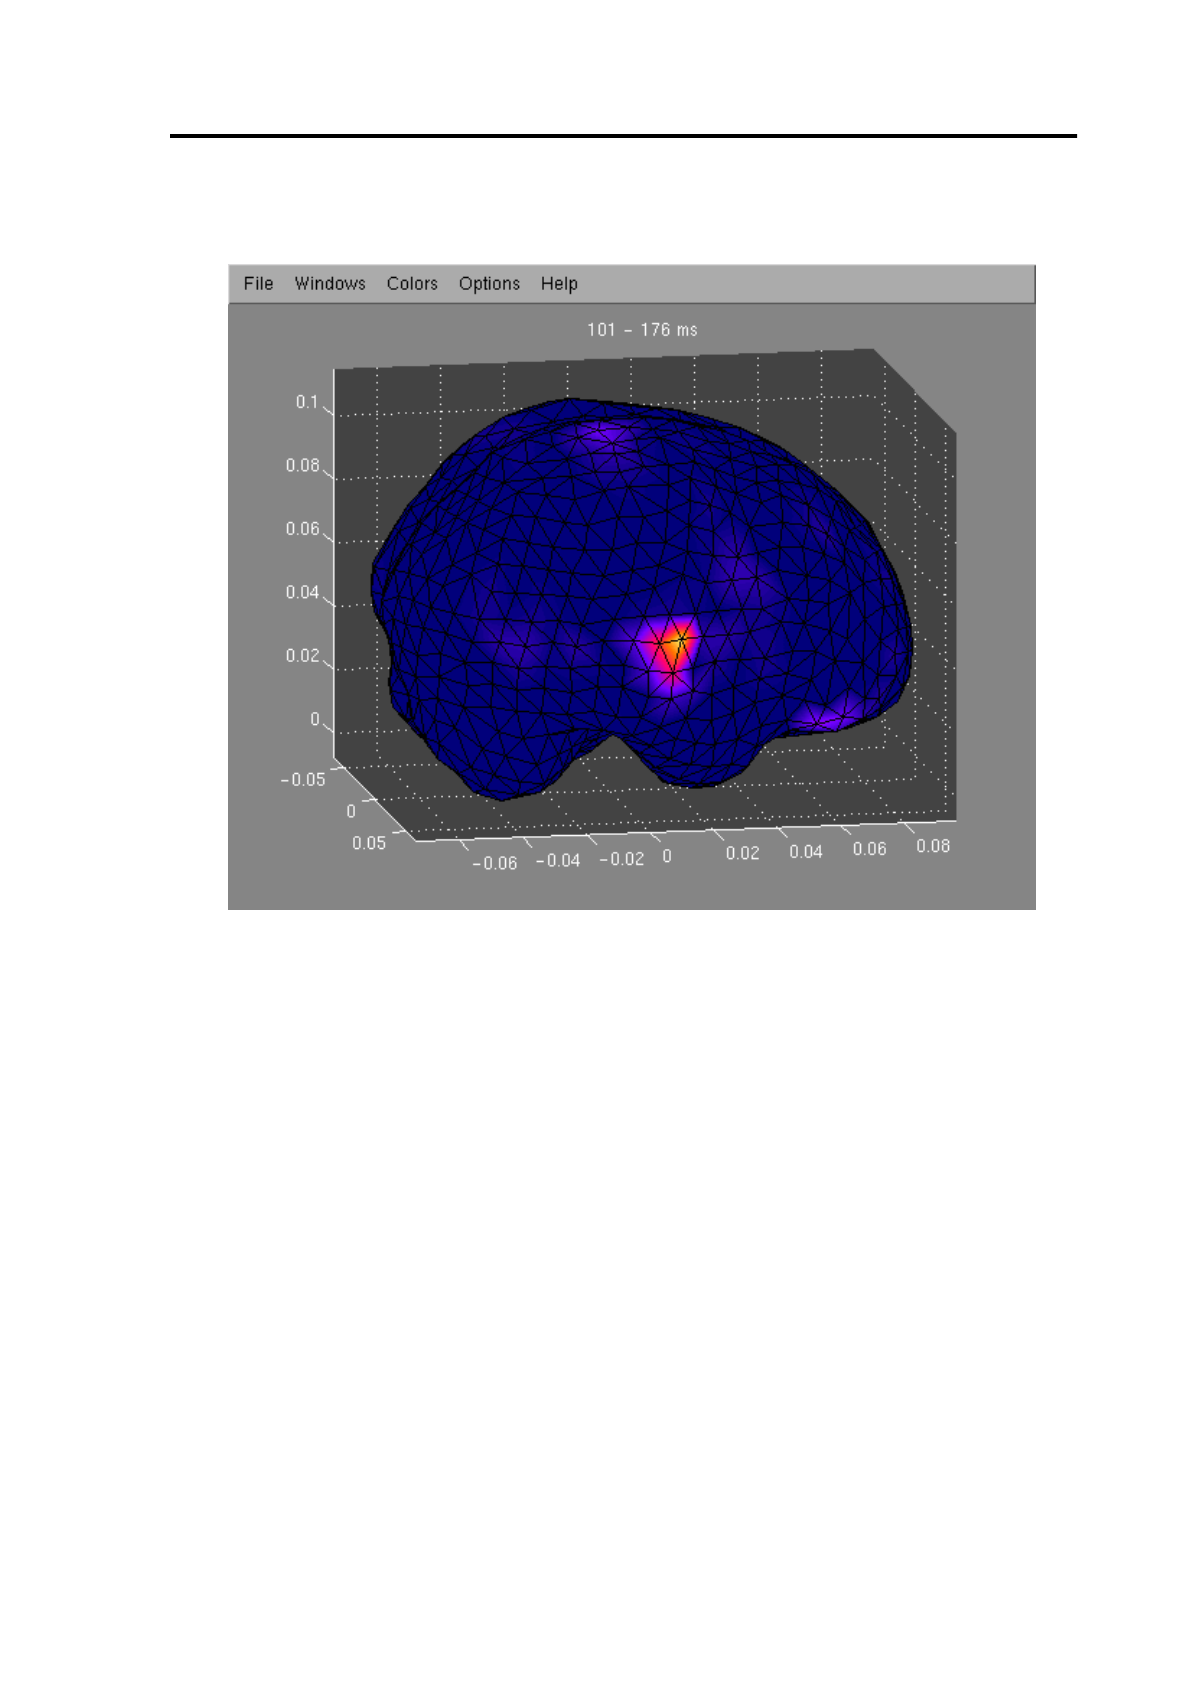
Figure 16 Color display of the estimate
The color display is opened by selecting [Color display] in the Windows menu
(p. 21).
The color display shows the estimated source distribution projected to the sur-
face of the brain. The projection is done along the radius of the sphere model. If
a time period is selected, the average activity during the period is shown.
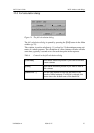
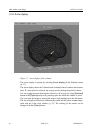
You can rotate the image by moving the mouse while holding down the left but-
ton. The color scale can be viewed and changed with the Color scale window (p.
33). The coloring of the window can be changed with the [Colors] menu.
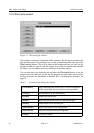
You can select a region of interest (ROI, “Region of interest” on page 14) by
pressing down the right mouse button and dragging over the active area. The
color display will show the selected activity only. You can toggle between
showing the selected or all activity by using [Selected] button in the [Options]
menu or by pressing space bar while the window is active.
You can view the location of the peak activity by selecting [Max] in the
[Options] menu