


MCE windows and dialogs MCE User’s Guide
30 2004-05-17 NM20600A-A
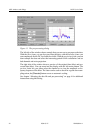
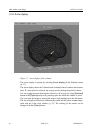
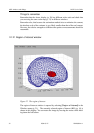
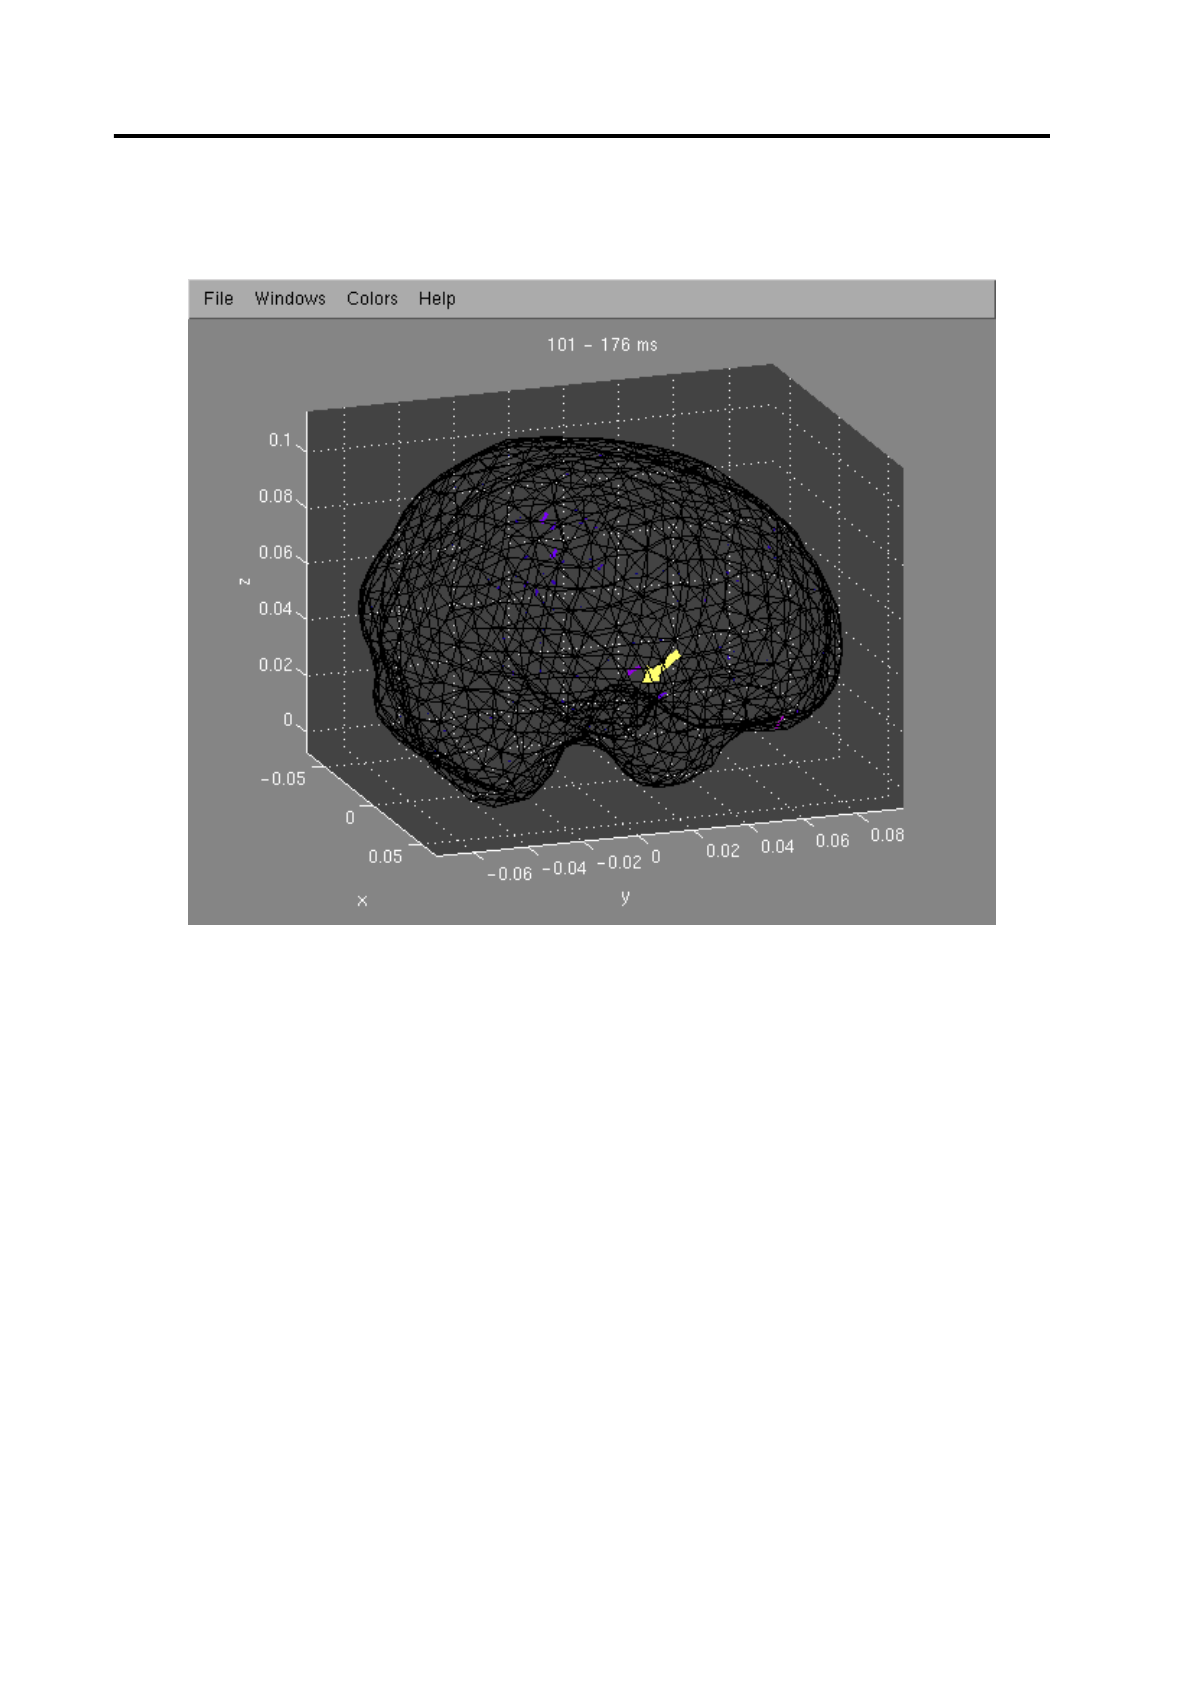
12.8 Arrow display
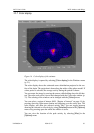
Figure 17 Arrow display of the estimate
The arrow display is opened by selecting [Arrow display] in the Windows menu
(p. 21).
The arrow display shows the 3-dimensional estimated source locations and orienta-
tions. If a time period is selected, the average activity during the period is shown.
You can toggle between showing the selected or all activity by using [Selected]
button in the [Options] menu or by pressing space bar while the window is active.
You can rotate the image by moving the mouse while holding down the left button.
The arrow length and colors are automatically scaled and the colors are not compa-
rable with the Color scale window (p. 33). The coloring of the arrows can be
changed with the [Colors] menu.