


Fluke 43B
Users Manual
12
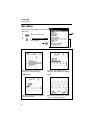
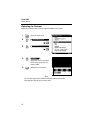
Time resolution in Sags & Swells and Record modes.
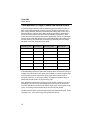
The modes Sags & Swells and Record basically perform similar functions. In
both modes Fluke 43B plots a trend of up to two electrical parameters over
time. In Sags & Swells mode the instrument plots voltage and current only. In
Record mode the analyzer plots a wide variety of parameters, depending on
the function that is active when the Record pushbutton is pressed. In both
modes the instrument plots the parameters periodically over the so-called plot
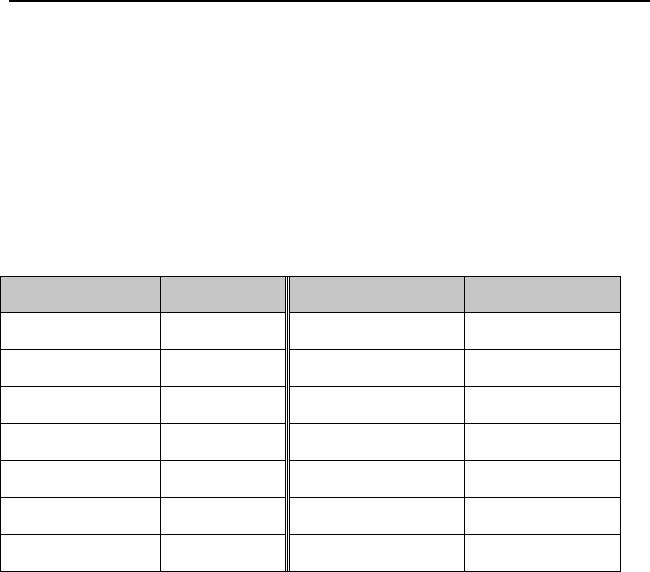
interval. Refer to the table below for the relationship between Recording Time
and Plot Interval. The relationship is based on the fact that there are always
240 plots across the horizontal screen width.
Recording Time Plot Interval Recording Time Plot Interval
4 minutes 1 second 8 hours 2 minutes
8 minutes 2 seconds 16 hours 4 minutes
16 minutes 4 seconds 24 hours 6 minutes
30 minutes 8 seconds 48 hours 12 minutes
1 hour 15 seconds 4 days 24 minutes
2 hours 30 seconds 8 days 48 minutes
4 hours 60 seconds Endless (16 days) 1 to 96 minutes
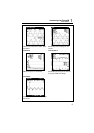
Fluke 43B always measures faster than the plot interval: it always is looking at
multiple measurements for each point that is plotted. In fact the analyzer looks
at all the measurements it has taken during a plot interval and records a
minimum, maximum, and average reading. The difference between Sags &
Swells and Record mode is in the measuring rate.
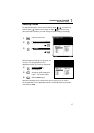
Sags & Swells is optimized for measuring short duration variations of current
and voltage. The rms current and voltage of every line cycle are measured.
The Fluke 43B then records the min (lowest single cycle), max (highest single
cycle), and average measurements at the end of each plot interval.
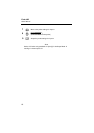
The Record mode takes measurements roughly 250 milliseconds apart. It also
records the min, max, and average during each plot interval.