


FortiGuard Analysis and Management Service Version 1.2.0 Administration Guide
30 13-12000-406-20081031
Configuring widgets Dashboard
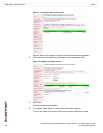
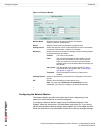
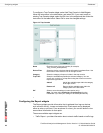
To configure a Trap Console widget, select Add Trap Console in Add Widgets,
follow the instructions in the table below, and select OK. If you want to edit an
existing Trap Console widget, select the Edit icon in the widget and then follow the
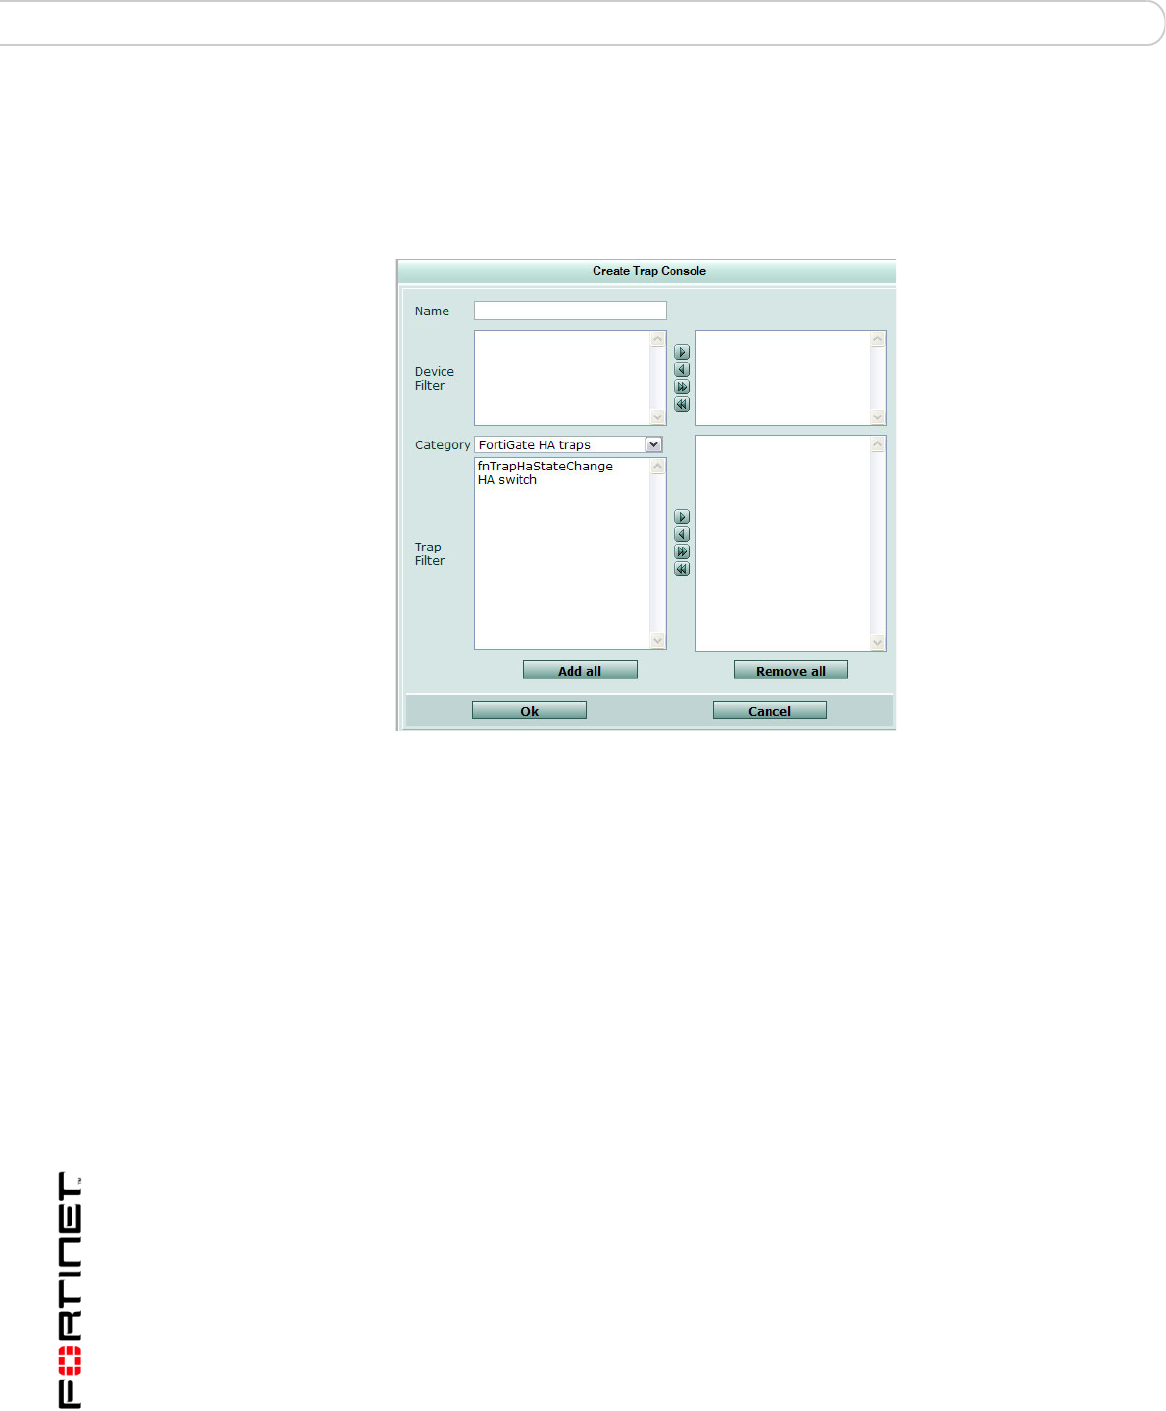
instructions in the table below. Select OK to save the changed settings.
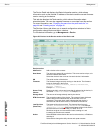
Figure 14: Trap Console
•
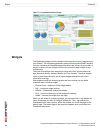
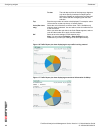
Configuring the Report widgets
The Report widgets provide information that is gathered from logs on devices,
such as traffic activity, viruses and web activity. Each report can be displayed
either as a bar or pie chart. From anywhere in a chart, you can drill down to view
second-level information for that report.
The seven available report widgets are:
• Traffic Report – provides information about network traffic based on traffic logs
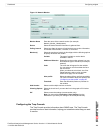
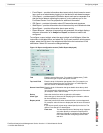
Name Enter the name of the trap console (for example,
Trap_Console_Headquarters).
Device Filter Select the device or devices that the information is gathered from. Use
the arrows to move devices over to the right column.
Category Select the category of traps to include in the trap console.
Trap Filter Select the available traps within the selected category. You can
specify one, multiple, or all trap filters using the arrows to move the
traps to the right column.
Add all Add all the available traps within the category
to the right column.
Remove all Remove all the available traps within the
category back to the left column.
OK Select to save the settings (current session only).
Note: You must select Customize > Save Settings from the
Dashboard if you want your settings to be saved permanently.