


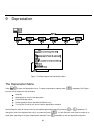
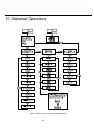
Statistical Operations
64
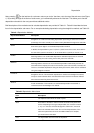
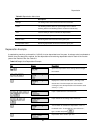
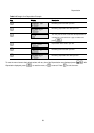
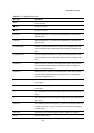
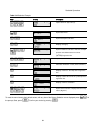
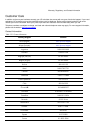
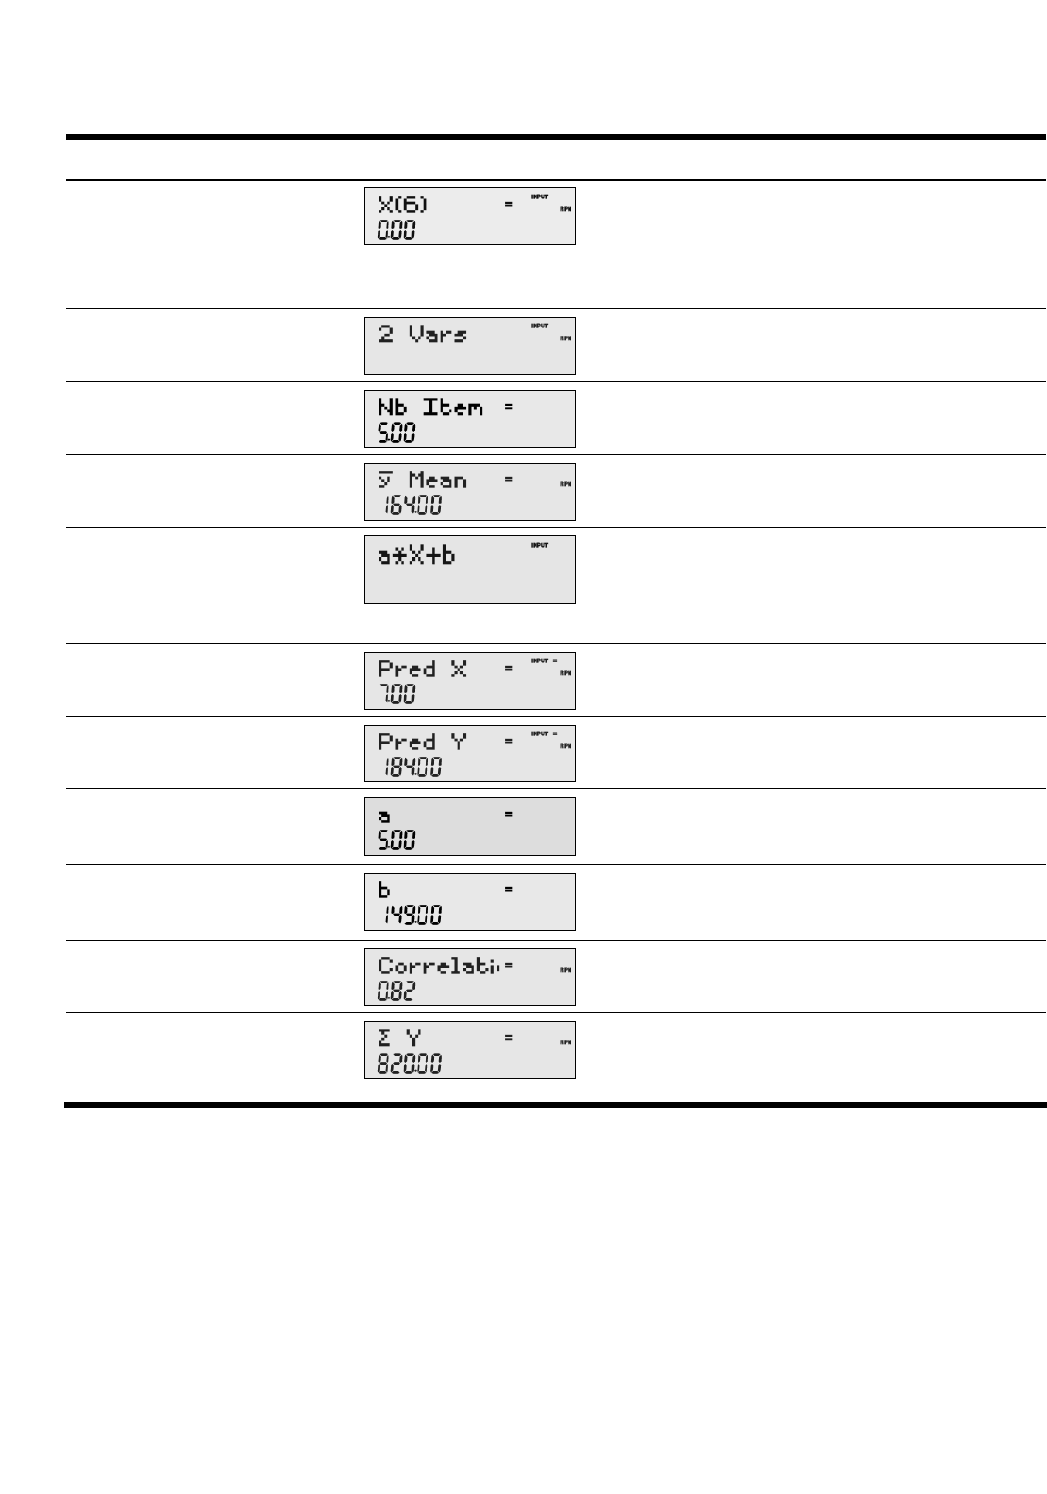
Table 10-3 Statistics Example
Keys Display Description
5I1
70I
Inputs values for X(5) and Y(5).
:z
Opens Stats menu.
<I
Opens Descriptive sub-menu.
<<
Displays average
y
.
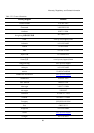
:z<<
I
Opens Predictions sub-menu. Note: this example
performs calculations based on a linear
(a*X+b) regression line.
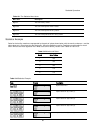
<7I
Inputs
7
as the
Prediction X
value (month 7).
<=
Calculates
Prediction Y
value (sales at month 7).
<
Displays value for
a
: the slope of the regression
line.
<
Displays current value for
b
: the y-intercept of the
regression line.
<
Displays value for
Correlation
.
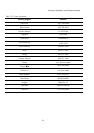
:z<<
<I<
Opens
Sums
sub-menu. Displays the sum of all y
values (Sigma Y).
To reset the menu items to their default values, with any item of the Data or Statistics menus displayed press :x. At
the prompt,
Stats
, press I. Confirm your choice by pressing I.