


Chapter 3 Windows and Menus
© National Instruments Corporation 3-13 NI-FBUS Monitor User Manual
Drop-Down List
Time Measured Allows you to select the time calculation
to perform on the packet. The options are
as follows:
Absolute—Shows the absolute time
relative to the start of the NI-FBUS
Monitor utility.
Idle—Shows the idle time between
packets.
From Start—Shows the time from the
start of one packet to the start of the next
packet.
From End—Shows the time from the
end of one packet to the end of the next
packet.
Transmission—Shows the time it took to
transmit a packet.
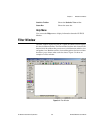
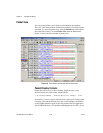
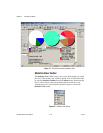
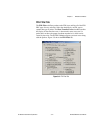
Statistics View
The statistics view shows the volume of the types of fieldbus packets
passed over the bus, and the bus time (or bandwidth) that these packets
consume. To select this view, click the Statistics tab at the bottom left of
the filter window, or select Statistics View from the View menu. The most
useful statistics chart is the Bandwidth chart. It is a pie chart showing the
relative use of bandwidth for the FMS, FAS, and FDL packets as a fraction
of the whole bus time. The FMS Services chart displays the volume of the
different types of services transmitted from the FMS layers of the bus
devices. The FMS Services chart is a breakdown of the FMS PDU section
of the Bandwidth chart. The FDL PDUs chart shows the volume of the
FDL PDUs transmitted over the bus. The FDL PDUs chart is a breakdown
of the FDL PDU section of the Bandwidth chart. Figure 3-7 shows the
statistics view.