9
DECO
ATR
O
2
N
2
BAR GRAPHS
Tissue Loading Bar Graph (TLBG)
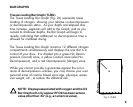
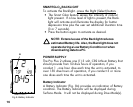
The Tissue Loading Bar Graph (Fig. 2a) represents tissue
loading of nitrogen, showing your relative no decompression
or decompression status. As your depth and elapsed dive
time increase, segments will add to the Graph, and as you
ascend to shallower depths, the Bar Graph will begin to
recede, indicating that additional no decompression time is
allowed for multilevel diving.
The Tissue Loading Bar Graph monitors 12 different nitrogen
compartments simultaneously and displays the one that is in
control of your dive. It is divided into a green No Decom-
pression (normal) zone, a yellow Caution zone (also No
Decompression), and a red Decompression (danger) zone.
While you cannot provide a guarantee against the occur-
rence of decompression sickness, you may choose your own
personal zone of caution based upon age, physique, exces-
sive weight, etc., to reduce the statistical risk.
NOTE: Displays associated with oxygen and the O2
Bar Graph will only appear if FO2 has been set at a
value other than 'Air' (e.g., a numerical value).
Fig. 2 - TLBG
a


