


EN
11
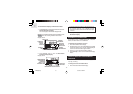
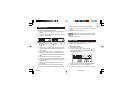
PRESSURE HISTORY DISPLAY
Barometric pressure readings can also be displayed
numerically.
To numerically display previous barometric pressure
levels:
1. Enter Barometric History Display.
2. Press [+] or [-] to display the corresponding barometric
pressure for the specified time period.
NOTES ON THE BAROMETER FUNCTIONS
Barometer readings may be affected by a change in
altitude.
The unit cannot distinguish between a change in air
pressure caused by weather patterns or by a change in
altitude. However, accurate functioning of the unit can
be maintained by following a few simple steps.
To ensure that accurate barometric readings are
maintained:
When the unit is stationed at the same elevation for
extended periods, it is advised to keep the unit in
Barometer Mode.
In addition to maximizing the weather forecasting
capabilities the unit requires less power to function.
Subsequently battery life may be extended.
2. Simultaneously press and hold [+] and [-] for about 2
seconds.
3. Simultaneously press again until the desired units
have been selected.
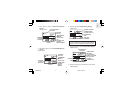
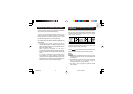
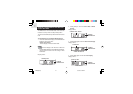
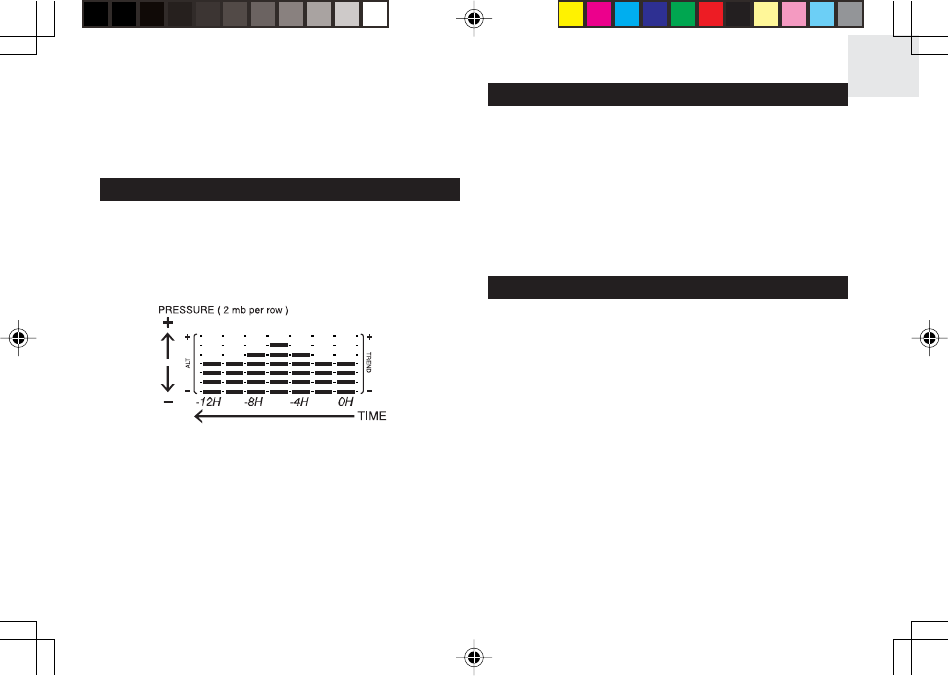
ABOUT THE PRESSURE CHANGE GRAPH
The EB833 can display barometric pressure levels at
intervals for the past 12 hours. Each vertical bar on the
Pressure Change Graph represents a 2-hour time period.
Each horizontal line represents pressure change equal
to + / - 2 mb/hPa.
An upward or downward direction of the vertical bars
may illustrate a changing pressure trend. Subsequently,
this may indicate changes in weather conditions.
However, as stated previously, caution needs to be
taken when attempting to predict weather forecasts.
( 2 HOURS PER COLUMN )
EB833(EN3) 8/31/04, 3:40 PM11