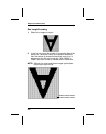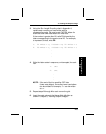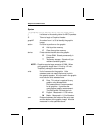
3. Using the Run Length Encoding chart in Appendix A,
replace each number you have written with its
corresponding code. Be sure to use
CAPITAL
letters for
black
dots and
lower-case
letters for
white
dots.
If the number is greater than 26, write Z, followed by the
letter corresponding to the amount over 26. For example,
to represent 30 dots, write ZD.
1. 21 white = u, 2 black = B, 21 white = u
2. 20 white = t, 4 black = D, 20 white = t
.
.
.
4. Write the letter codes in sequence, uninterrupted, for each
row.
1. uBu
2. tDt
.
.
.
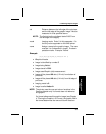
NOTE: If the end of the line specifies OFF dots
(lower-case letters), the ending lower-case letters
can be omitted.For example, uBu can be written
as uB.
5. Repeat steps 2 through 4 for each row on the grid.
6. Insert the code values in the bitmap field definition as
shown in Chapter 3, "Defining Graphic Images."
Charting the Graphic
Image
2. Creating the Graphic Image
2-5


