


12
13
RSA Real-T
ime Spectrum Analyzers
www
.tektronix.com/rsa
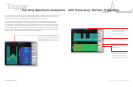
The analysis capabilities of the Real-T
ime Spectrum Analyzer provide simultaneous time-correlated views of a signal
in the frequency, time and modulation domains, enabling much faster resolution of complex problems that often
occur in today’s RF systems.
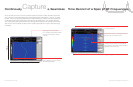
By acquiring a record of real-time signal behavior, the Real-Time Spectrum Analyzer supports numerous powerful
analysis tools. One example is the spectrogram display, which plots frequency and amplitude changes over time.
It provides an intuitive, three-dimensional display of the time-varying signal behavior, not seen in traditional frequency
domain plots. This view makes it easy to see phenomena such as modulation switching, signal hand-offs, frequency
hops and settling time between pulses, and changes in frequency over time.
In addition to providing time-correlated multi-domain analysis on a wide variety of signals, certain Tektronix Real-Time
Spectrum Analyzers support the latest mobile and wireless data standards, as well as providing a general purpose
digital modulation analysis on a wide variety of formats. With time-correlated views across the frequency, time and
modulation domains and a full range of analysis capabilities, you gain unprecedented insight into RF signal behavior
for complete characterization and quick problem-solving.
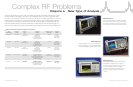
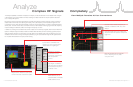
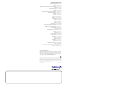
Analyze
Complex RF Signals Completely
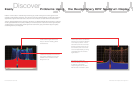
Views for EVM vs. time,
eye diagram, constellation
(with and without transitions),
IQ amplitude (or frequency
for GFSK) vs. time
Time-correlated views relate EVM,
symbol value or constellation with
frequency vs. power or spectrogram
representation of a digital signal
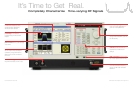
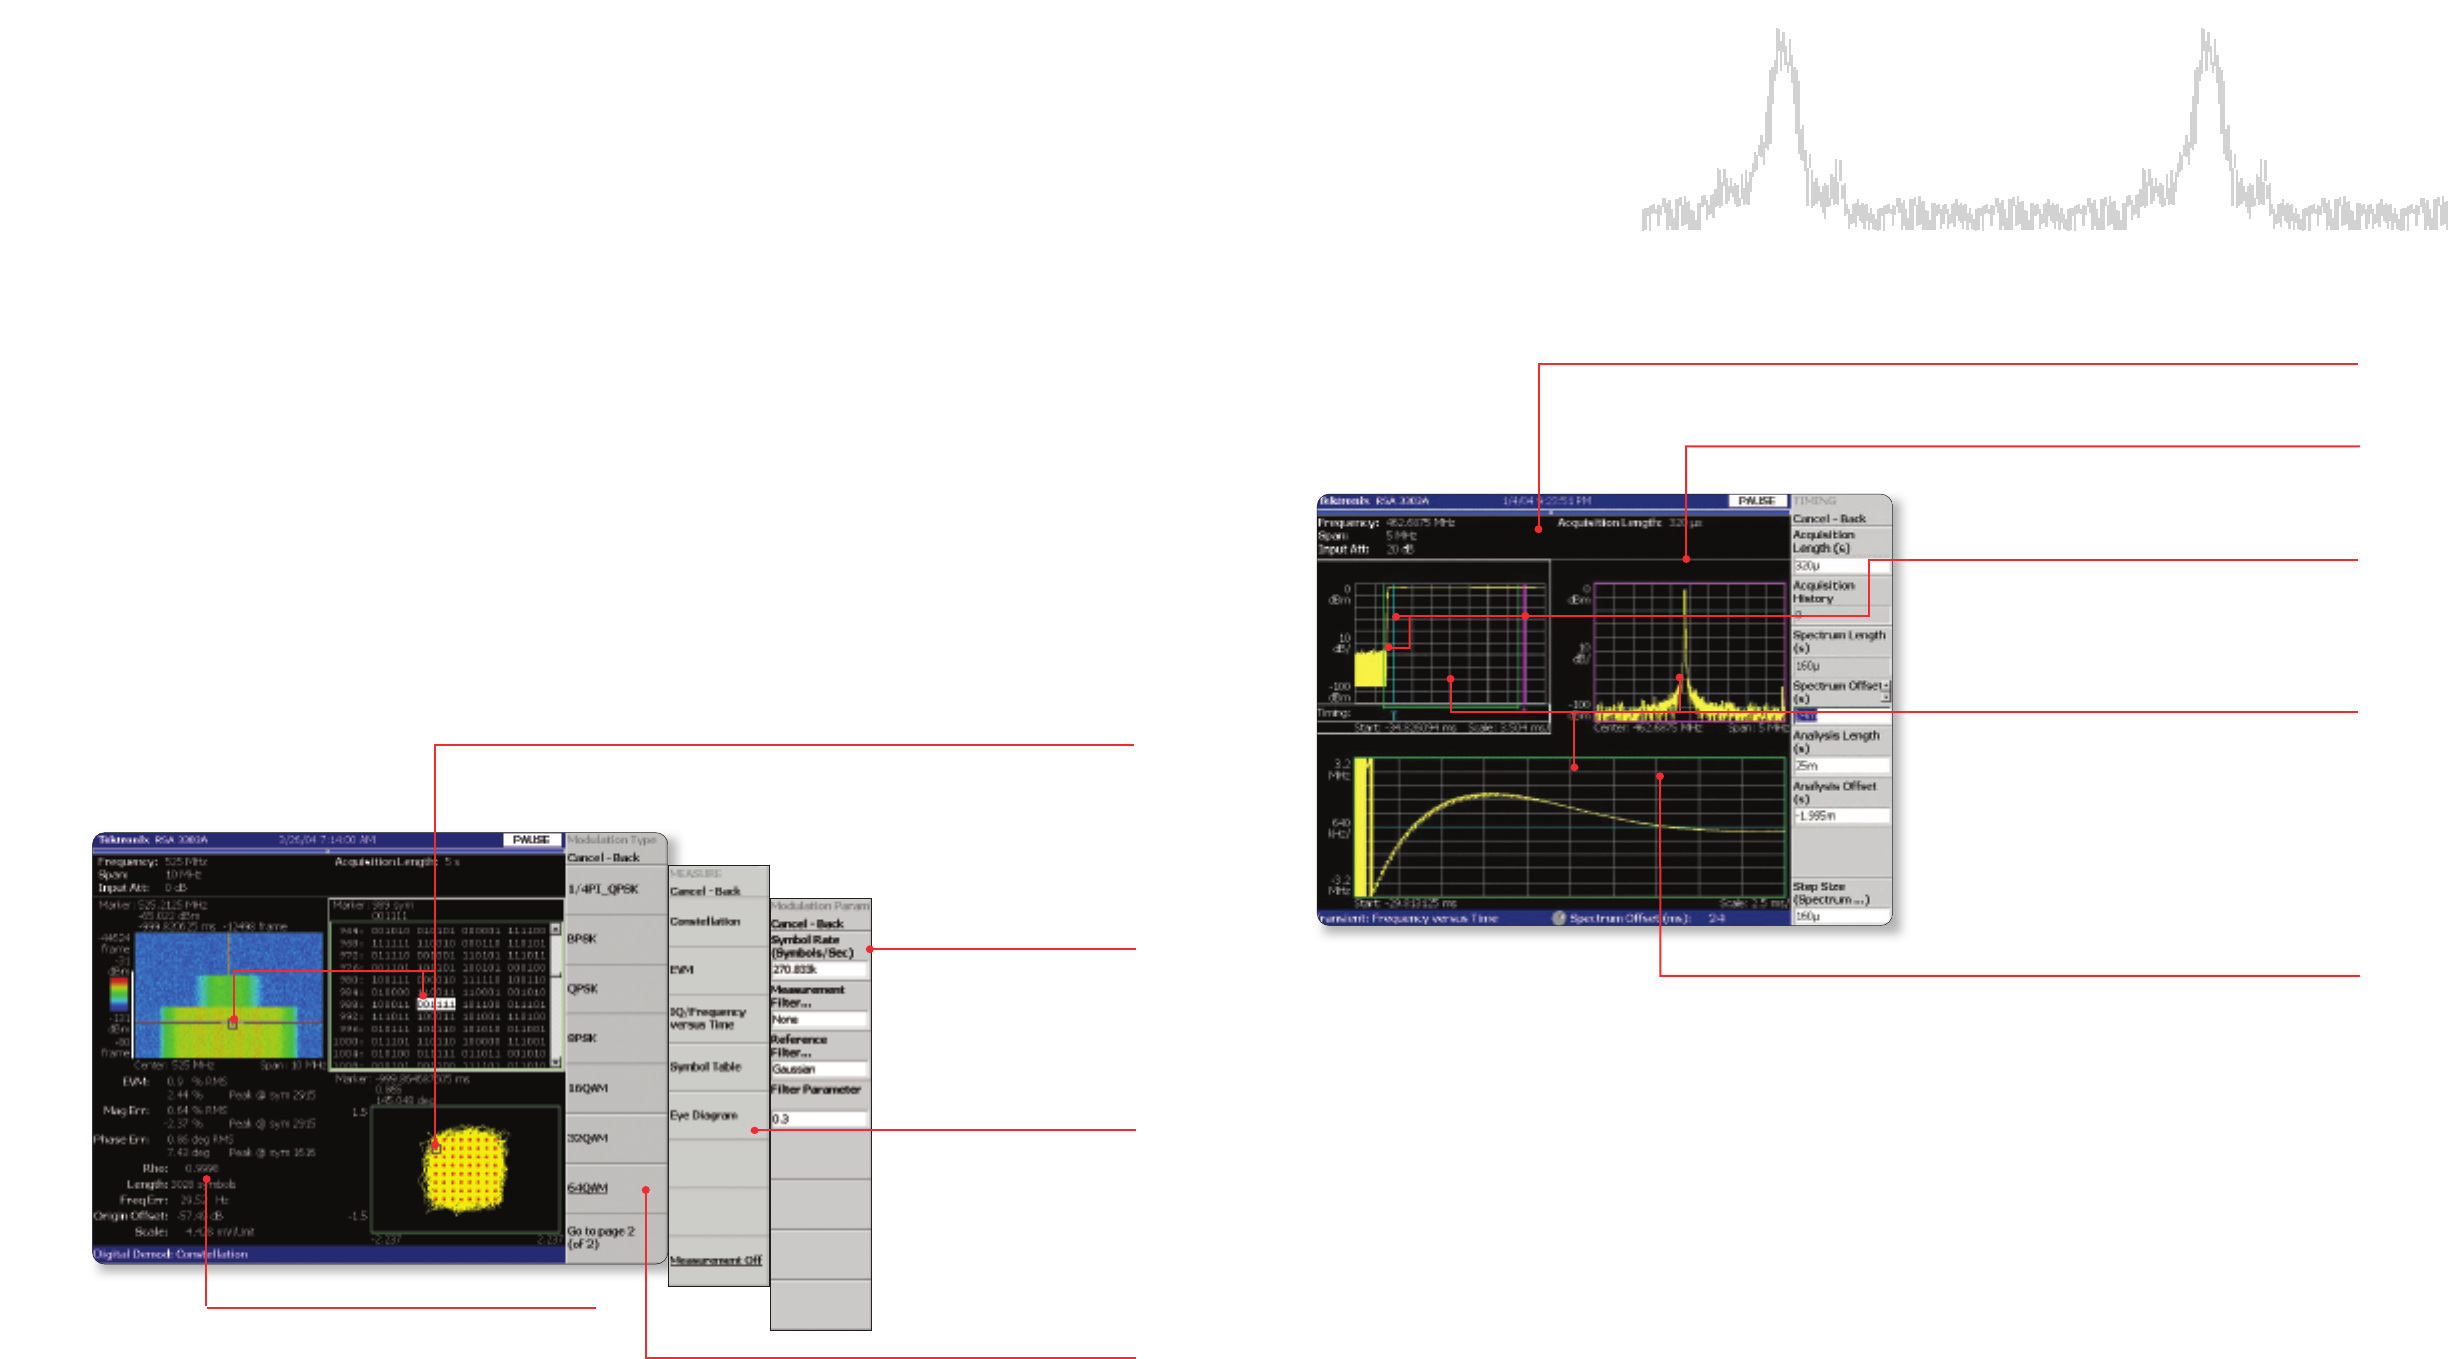
View Multiple Domains At Your Convenience
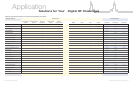
Modulation analysis for:
BPSK; QPSK; 16, 32, 64,
256 QAM; 8PSK;
π/4 DQPSK;
GMSK; GFSK and more
Automated measurements for EVM,
Magnitude Error
, Phase Error
, plus symbol
number where each measurement peaks
Settings for modulation
parameters, such as
symbol rate, measurement
filter and alpha/BW
product
Sub-view window: choice of frequency vs.
amplitude, constellation, EVM, many other
displays
Color-keyed lines show timing of Main View
analysis and Sub-View spectrum analysis and
trigger time
Measurements are time-correlated
Overview window: power vs. time
Main view window: time vs. amplitude,
time vs. frequency, time vs. phase,
many other views