GigaX Smart Switch Centralized Network Management 41
4.8 Statistics
Statistics offer Port Traffic, Traffic History and Comparison charts. The switch
has 3 counters for 8 kinds of statistics. So you cannot see all the statistics at
the same time. That is, the old statistics data will be gone if you start to use the
counter for another statistics.
4.8.1 Port Traffic
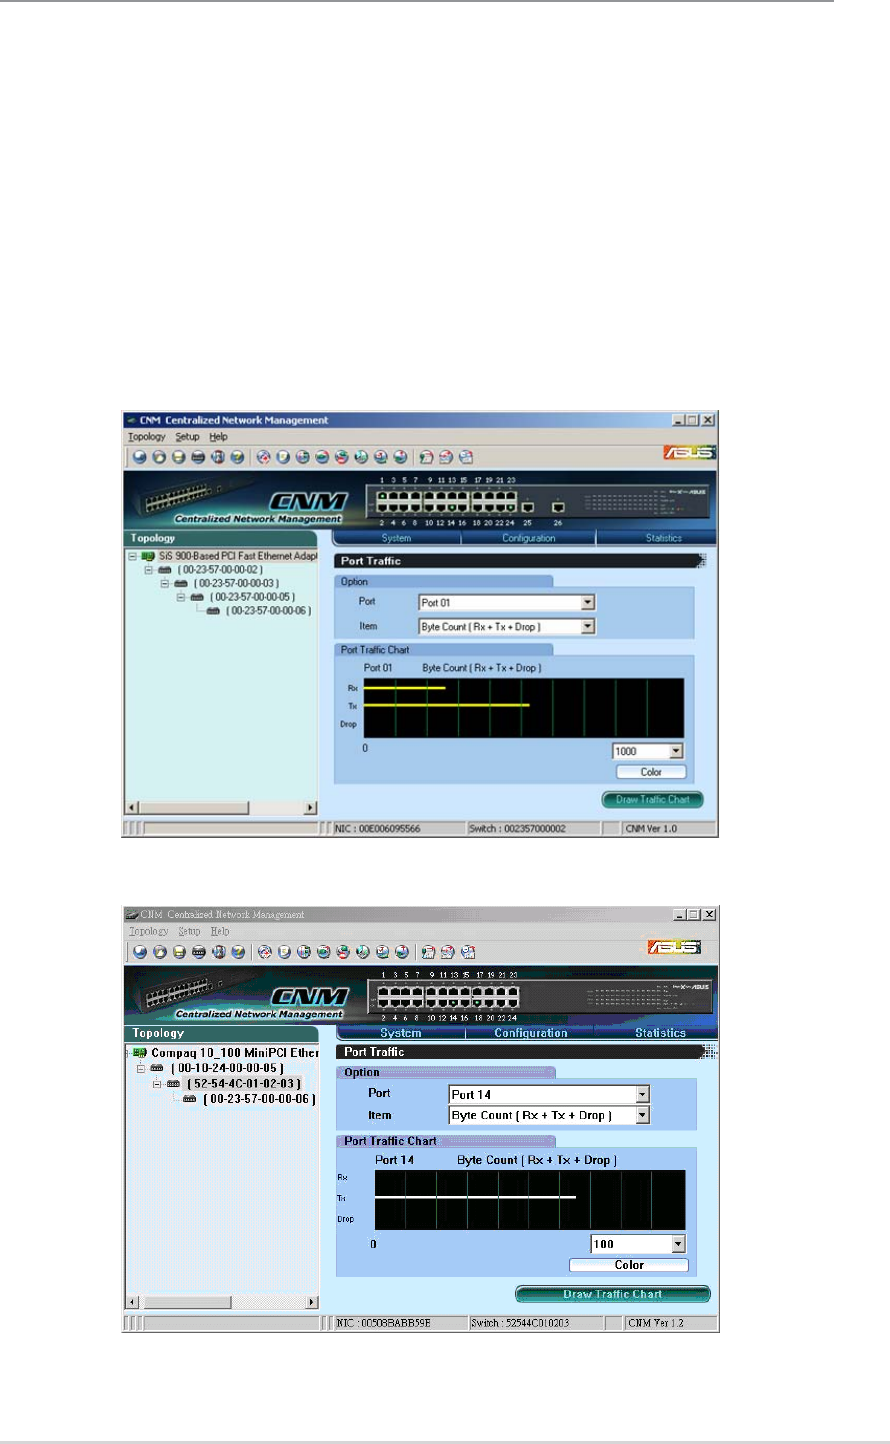
Select port number, the statistics item and color to draw the traffic chart. The
chart will be auto updated in the time interval you set in Setup menu. Refer to
4.3.2 for time interval setup.
Press the Draw Traffic Chart button to start drawing.
Figure 4.25 Port Traffic (GigaX 1024P)
Figure 4.25.1 Port Traffic (GigaX 1024I)


