


Chapter 1
5 Avaya P120 SMON User Guide
• Treating any variable with abnormal behavior as an issue that
should be investigated further using other SMON tools.
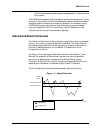
In general, the Switch Statistics tool can help you spot problems that only
become apparent from a high-level view over time. By periodically
viewing Switch Statistics, you can detect normal and abnormal behavior
of the specific switch configuration.
SMON collects and displays all information in real-time. In addition,
information collected during a session can be saved in a report.
Port Statistics Overview
The Port Statistics tool measures the traffic travelling through each port
on the selected device. For each port, SMON summarizes the traffic, such
as packets into the device and packets from the device. You can sort by
port name or by any of the packet types. You can see, for example, the
ports generating the most errors.
If you notice that a particular port displays a disproportionate amount of
errors, this may suggest that a device connected to the port is responsible
for the problem.
You select the most active ports by using a rate base. SMON measures the
rate base for all the ports to find the most active ports and then displays
these ports and their statistics. This process is called Port TopN.
Using the Port Statistics tool in conjunction with VLAN Statistics and
Switch Statistics makes it straightforward to discover the cause of a
problem. For example, using Switch Statistics you may discover that there
are too many errors on a specific switch. You could then use Port Statistics
to help indicate the port from which the problem originates.
VLAN Statistics Overview
The VLAN Statistics tool measures the switched traffic travelling through
VLANs on the selected switch. A VLAN consists of stations connected
logically rather than physically. A VLAN can be used, for example, to
distribute network resources by department, even if the department’s
stations are not all located in the same area. Therefore, a VLAN can
incorporate stations from different devices.
By comparing the load of each VLAN you can discover which VLANs are:
• Utilizing their full capacity.
• Under capacity.