


Chapter 3
17 Avaya P120 SMON User Guide
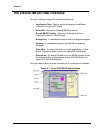
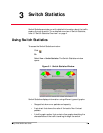
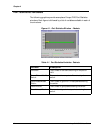
The title of the Switch Statistics window displays the Device IP Address.
The gauges, pie charts and bar graph show data for the time furthest to
the right currently visible on the traffic graph. For more information, refer
to “Traffic Graph in the Switch Statistics Window” on page 18.
You can use the gauges, pie charts, and the traffic graph to view data from
an earlier point in time by scrolling the traffic graph. For more
information about modifying the display, refer to Appendix A, Using the
General Options Dialog Box. For more information on the available toolbar,
status bar, and mouse movement options, refer to Chapter 2, Working with
Device SMON Tools.
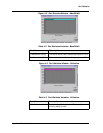
Gauges and Pie Charts in the Switch Statistics Window
For Avaya P120 Devices, the gauges at the top of the window display the
following information:
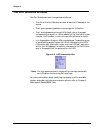
For Avaya P120 Devices, the pie chart at the top of the window displays
the following information:
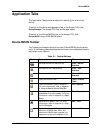
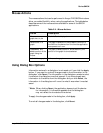
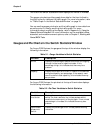
Table 3-1. Gauge Variables in Switch Statistics
Variable Description
Errors Displays the percentage of packets that contain errors going
through the device on a logarithmic scale. If this
percentage is high, this indicates that there may be a
problem.
Capacity Displays the proportion of traffic in relation to the device’s
configured capacity, as a percentage. If the capacity used
nears the device’s total capability, this indicates there may
be a problem.
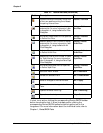
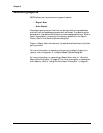
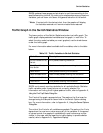
Table 3-2. Pie Chart Variables in Switch Statistics
Variable Description
Good Unicasts
Into Switch
Displays the percentage of unicast packets entering the
device. On most networks, the unicast packets should
constitute the vast majority of the pie graph. If non-unicast
packets begin to increase, this indicates there may be a
problem.
Good Bcasts/
Mcasts Into
Switch
Displays the percentage of non-unicast packets entering
the device.