


75
2.048Mb
p
s Wireless Modem
TECHNICAL: 0118 931 2233
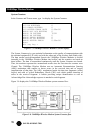
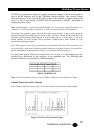
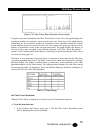
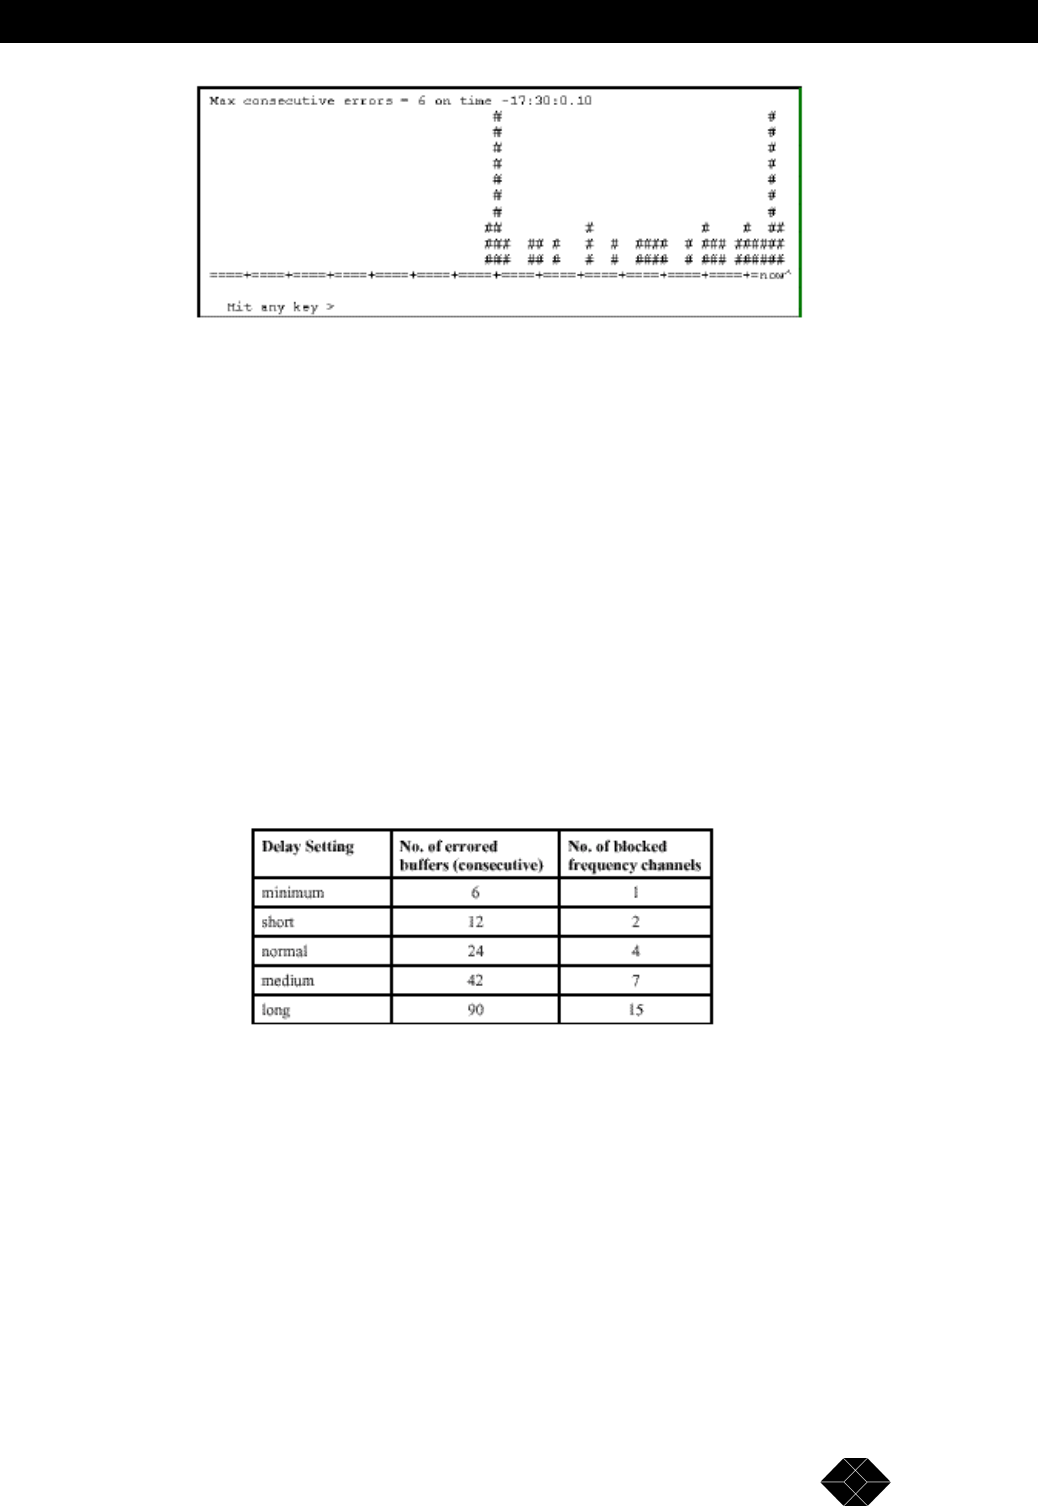
Figure 3-12. Time Tracer Max Consecutive Errors Graph
Using the same time resolution as the Time Tracer Errors versus Time, this graph displays the
maximum number of consecutive errors in each time unit. At the top of the graph appears
information on the maximum number of consecutive errors identified during the tracing
period, and how much time passed since this event. Each column in the graph represents the relative
number of consecutive errors in the relevant time period. The graph displays the history of
the last 69 time units according to the defined resolution (“Set Time Tracer Resolution” -
option 7 in the Counters and Tracers Menu), or the history since the last time the Time Tracer
was reset (see also page 76).
This tracer is very important, since long bursts of consecutive errors can pass the ARQ error
correction algorithm uncorrected. The above tracer shows when these long bursts occurred,
and their length. The longest (isolated) burst of consecutive errors tolerated by the ARQ
algorithm depends on the delay setting. The following table displays for each delay setting
the maximum number of consecutive errors and blocked frequency channels resulting in no
errors at the LIU due to the ARQ algorithm:
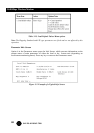
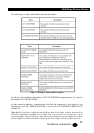
Table 3-17. Delay Setting
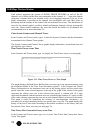
Set Time Tracer Resolution
When the Time Tracer is displayed, you can view up to 69 traced time intervals.
⇒ To set the time intervals:
1. In the Counters and Tracers menu type 7. The Set Time Tracer Resolution screen
shows, displaying the current resolution.