


Creating Bridge Traffic Charts, Graphs, and Meters 6-27
Using the 7C0x SmartSwitch Bridge View
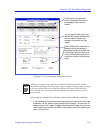
Designated Port
The Port ID of the port on the Designated Bridge for this port’s segment. The
Designated Port is the bridge port that offers the lowest path cost to the Root
Bridge.
Forward Transitions
The number of times this port has moved from the Learning state to the
Forwarding state since the device was started or since it was last reset.
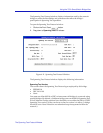
Changing a Port’s STA Parameters
To change a port’s Priority or Path Cost:
1. In the scroll list, click mouse button 1 on the port you want to change (use the
scroll bar if necessary to display the desired port). You can only select one
port at a time. The highlighted port’s Spanning Tree parameters appear in the
boxes below the list.
2. Highlight and edit the Priority and Path Cost boxes as required. After you
type in the new value in a box, press Enter or Return on the keyboard.
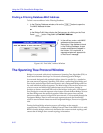
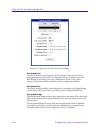
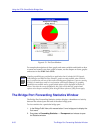
Creating Bridge Traffic Charts, Graphs, and Meters
The Bridge application uses the SPMA Charts, Graphs and Meters tools to depict
bridge statistics describing activity at the bridge-port level. Once running,
however, a pie chart, graph or meter is independent from the application where it
was started. Although the windows you open to create pie charts, graphs and
meters have unique variable lists, the procedures for creating a pie chart, a graph
or a meter are the same.
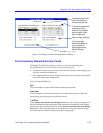
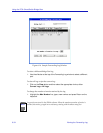
To access the Pie Chart, Graph, and Meters tools from the Bridge Traffic View Port
menus:
1. Click mouse button 3 on a Bridge Port box to display the Bridge Port menu.
2. Drag down to select Pie Chart or Graphs/Meters—>Transparent.