


E-49
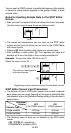
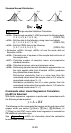
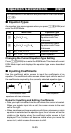
Standard Normal Distribution
Appendix Single-variable Statistical Calculation
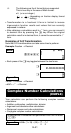
<#053> Select single-variable (1-VAR) and input the following data:
{1, 2, 3, 4, 5, 6, 7, 8, 9, 10} (FREQ: ON)
<#054> Edit the data to the following, using insert and delete:
{0, 1, 2, 3, 4, 5, 6, 7, 9, 10} (FREQ: ON)
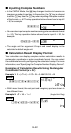
<#055> Edit the FREQ data to the following:
{1, 2, 1, 2, 2, 2, 3, 4, 2, 1} (FREQ: ON)
• Examples <#056> through <#059> all use the same data as
Example <#055>.
<#056> Calculate sum of squares of the sample data and sum of
the sample data.
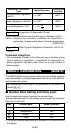
<#057> Calculate number of samples, mean, and population
standard deviation.
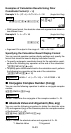
<#058> Calculate minimum value and maximum value.
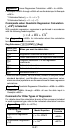
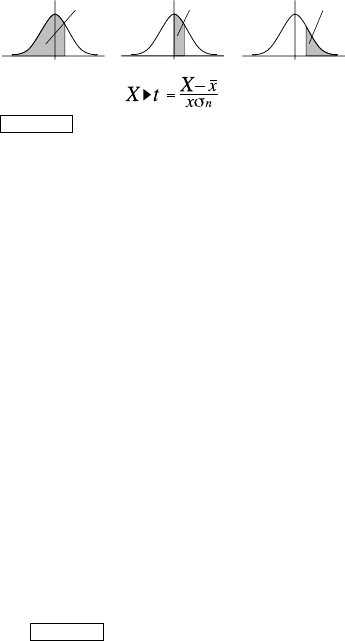
<#059> Performing standard normal distribution approximation on
the input sample data (from Example <#055>) produces
the probabilities shown below.
Distribution probability that is a value less than the
normalized variate when the sample value is 3 (P value for
normalized variate when X = 3)
Distribution probability that is a value greater than the
normalized variate when the sample value is 7 (R value for
normalized variate when X = 7)
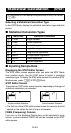
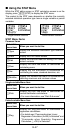
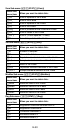
Commands when Linear Regression Calculation
(A+BX) Is Selected
With linear regression, regression is performed in accordance with
the following model equation.
y
=
A
+
BX
The following are the commands that appear on the sub-menus that
appear when you select 4(Sum), 5(Var), 6(MinMax), or
7(Reg) on the STAT menu while linear regression is selected as
the statistical calculation type.
See Appendix <#060> for information about the calculation
formula used for each command.
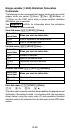
P
(t)Q
(t)R
(t)
0 t 0 t 0 t