


20010101
uu
uu
uLinearReg t Test
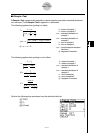
LinearReg t Test treats paired-variable data sets as (x, y) pairs, and uses the method of
least squares to determine the most appropriate a, b coefficients of the data for the
regression formula y = a + bx. It also determines the correlation coefficient and t value, and
calculates the extent of the relationship between x and y.
b =
Σ
( x – o)( y – p)
i=1
n
Σ
(x – o)
2
i=1
n
a = p – bo t = r
n – 2
1 – r
2
a :intercept
b :slope of the line
n :size of sample (n > 3)
r : correlation coefficient
r
2
: coefficient of
determination
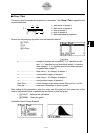
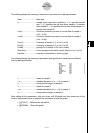
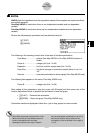
Perform the following key operations from the statistical data list.
3(TEST)
c(T)
d(LinReg)
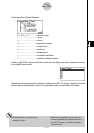
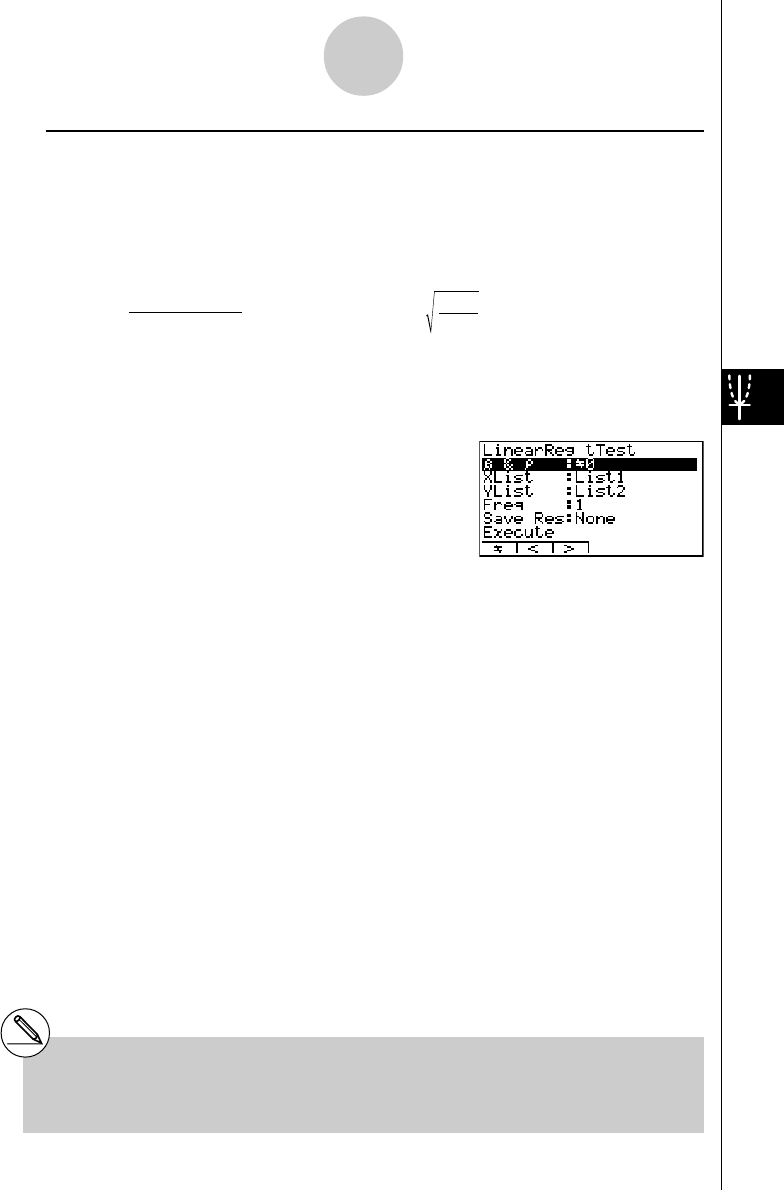
The following shows the meaning of each item in the case of list data specification.
β
&
ρ
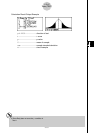
............................ p-value test conditions (“G 0” specifies two-tail test, “< 0”
specifies lower one-tail test, “> 0” specifies upper one-tail
test.)
XList ............................ list for x-axis data (List 1 to 20)
YList ............................ list for y-axis data (List 1 to 20)
Freq ............................. frequency (1 or List 1 to 20)
Save Res ..................... list for storage of calculation results (None or List 1 to 20)
Execute ....................... executes a calculation
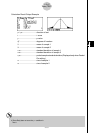
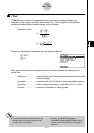
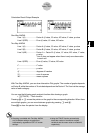
After setting all the parameters, align the cursor with [Execute] and then press the function key
shown below to perform the calculation.
• 1(CALC) ... Performs the calculation.
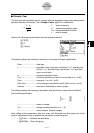
# You cannot draw a graph for LinearReg t
Test.
1-2-16
Tests (TEST)
20011101