


20010101
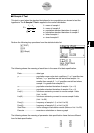
• Logarithmic Regression ...
MSE =
Σ
1
n – 2
i=1
n
(y
i
– (a + b ln x
i
))
2
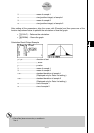
•Exponential Repression ...
MSE =
Σ
1
n – 2
i=1
n
(ln yi – (ln a + bxi ))
2
•Power Regression ...
MSE =
Σ
1
n – 2
i=1
n
(ln y
i
– (ln a + b ln x
i
))
2
•Sin Regression ...
MSE =
Σ
1
n – 2
i=1
n
(y
i
– (a sin (bx
i
+ c) + d ))
2
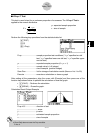
• Logistic Regression ...
MSE =
Σ
1
n – 2 1 + ae
-bx
i
C
i=1
n
y
i
–
2
uu
uu
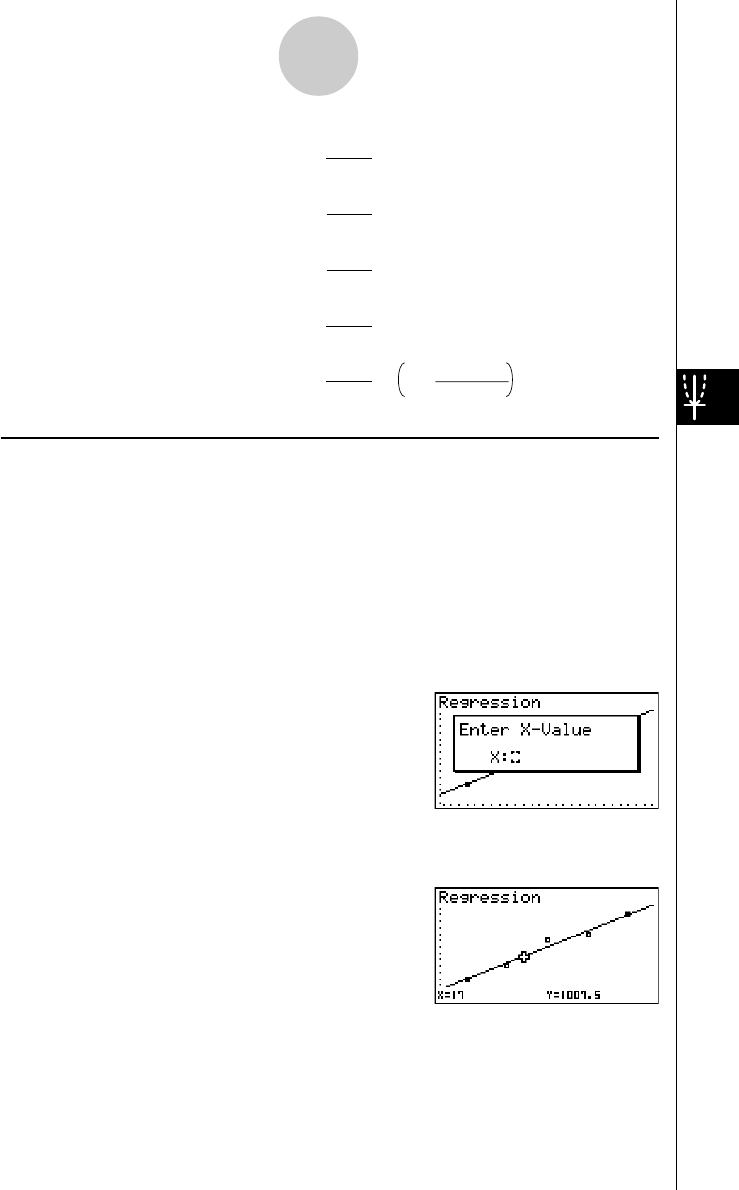
uEstimated Value Calculation for Regression Graphs
The STAT Mode also includes a Y-CAL function that uses regression to calculate the
estimated y-value for a particular x-value after graphing a paired-variable statistical
regression.
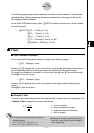
The following is the general procedure for using the Y-CAL function.
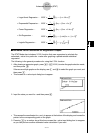
1. After drawing a regression graph, press 6(g)2(Y-CAL) to enter the graph selection mode,
and then press w.
If there are multiple graphs on the display, use f and c to select the graph you want, and
then press w.
• This causes an x-value input dialog box to appear.
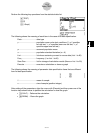
2. Input the value you want for x and then press w.
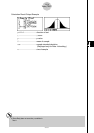
• This causes the coordinates for x and y to appear at the bottom of the display, and moves the
pointer to the corresponding point on the graph.
3. Pressing v or a number key at this time causes the x-value input dialog box to reappear
so you can perform another estimated value calculation if you want.
1-1-2
Advanced Statistics (STAT)
20011101