20010101
4. After you are finished, press i to clear the coordinate values and the pointer from the
display.
· The pointer does not appear if the calculated coordinates are not within the display range.
·The coordinates do not appear if [Off] is specified for the [Coord] item of the [SETUP] screen.
· The Y-CAL function can also be used with a graph drawn by using DefG feature.
uu
uu
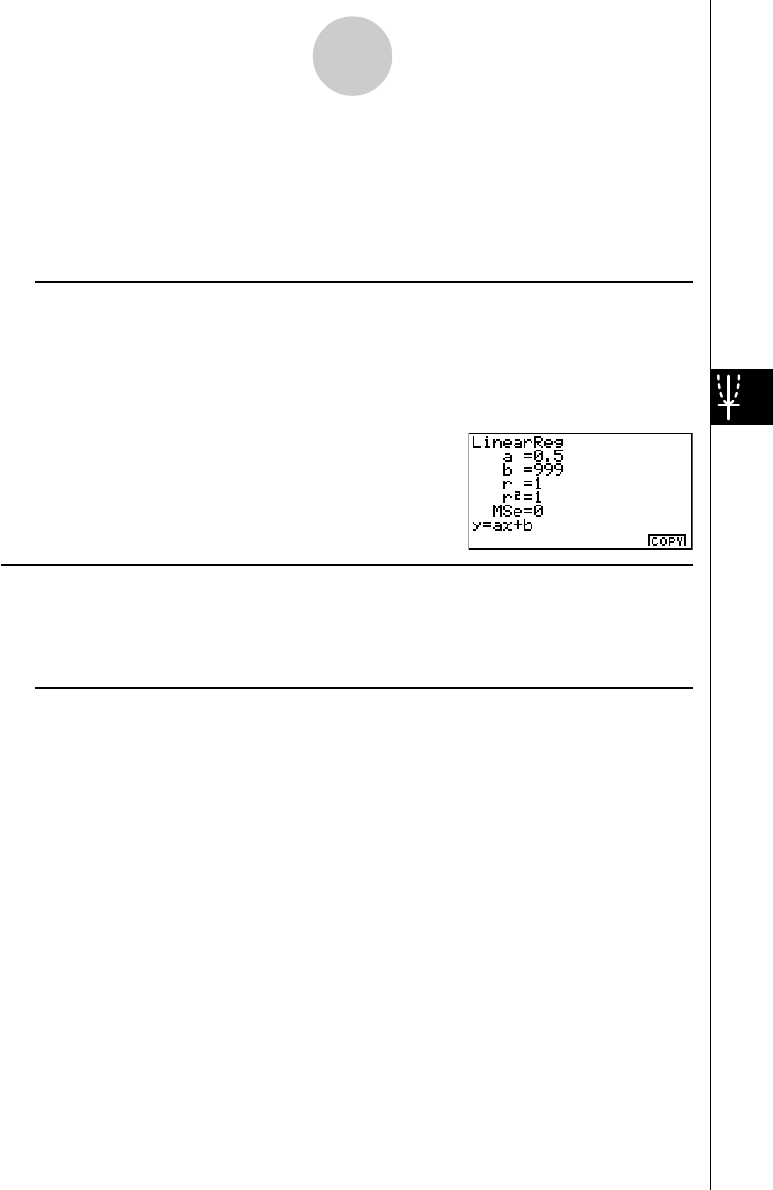
uRegression Formula Copy Function from a Regression Calculation Result
Screen
In addition to the normal regression formula copy function that lets you copy the regression
calculation result screen after drawing a statistical graph (such as Scatter Plot), the STAT Mode
also has a function that lets you copy the regression formula obtained as the result of a regression
calculation. To copy a resulting regression formula, press 6(COPY).
kk
kk
k Tests, Confidence Interval, and Distribution Calculations
The STAT Mode includes functions for performing tests, and confidence interval and distribution
calculations. You can find explanations of each of these functions in the following sections: 1-2
Tests, 1-3 Confidence Interval, and 1-4 Distribution.
uu
uu
uParameter Settings
The following describes the two methods you can use to make parameter settings for test,
confidence interval, and distribution calculations.
• Selection
With this method, you press the function key that corresponds to the setting you want to
select from the function menu.
• Value Input
With this method, you directly input the parameter value you want to input. In this case,
nothing appears in the function menu.
·Pressing i returns to the list input screen, with the cursor in the same position it was at
before you started the parameter setting procedure.
· Pressing ! i(QUIT) returns to the top of list input screen.
· Pressing w without pressing 1(CALC) under “Execute” item advances to calculation
execution. To return to the parameter setting screen, press i, A, or w.
1-1-3
Advanced Statistics (STAT)


