


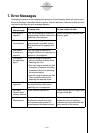
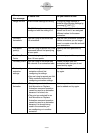
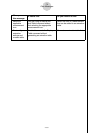
20060601
6-7
Working with Animations
Generating an Animation Table
Under default settings, an animation causes a specifi ed point to move along a specifi ed
line segment, circle, or arc in 20 steps. You can confi gure the calculator to generate a table,
called an “animation table”, which records the coordinates of each step, the length of the line
segment, the area of the object, etc.
Any of the following data can be added to the animation table: coordinates ( x , y ), distance/
length, slope, radius, circumference, perimeter, area, angle, supplementary angle, vector
segments ( x , y ), and expression.
u To add columns to the animation table
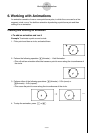
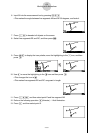
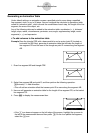
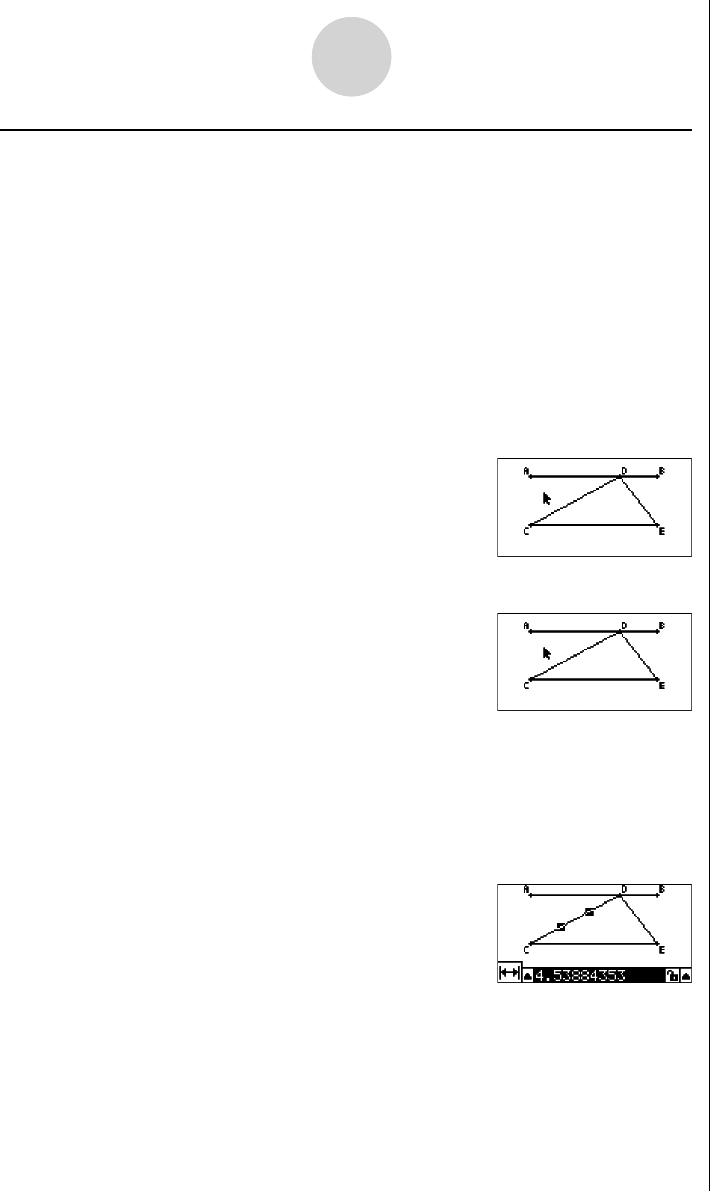
Example: Draw the triangle CDE with a base parallel to and a vertex (point D) located on
horizontal line AB. Next, generate an animation table that includes the length of
line segment CD and the area of the triangle as point D moves along line segment
AB.
1. Draw line segment AB and triangle CDE.
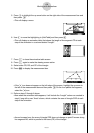
2. Select line segment AB and point D, and then perform the following operation:
6(Animate) – 1:Add Animation.
• This will add an animation effect that causes point D to move along line segment AB.
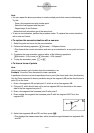
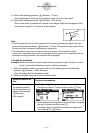
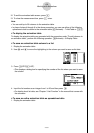
3. Here we will generate an animation table for the length of line segment CD, so fi rst select
line segment CD.
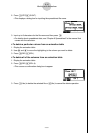
4. Press J to display the measurement box.
• If the = icon does not appear on the left edge of the screen, highlight the up arrow to
the left of the measurement box and then press w. On the icon palette that appears,
select the = icon.
20070101