


5-12
Cisco 12000/10700 v3.1 Router Manager User Guide
OL-3865-01
Chapter 5 Managing Modules
Module Performance
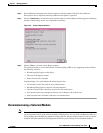
Step 3 Click Start to begin performance logging for the selected module. Click Stop to stop performance
logging for the selected module.
Step 4 Launch the Performance Manager application to view the historical performance information for the
selected module. Refer to Chapter 20, “Performance Management and Historical Data,” for further
information on how to use the Performance Manager application.
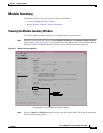
Module Performance Window—Detailed Description
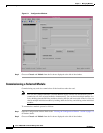
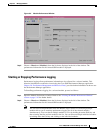
The Module Performance window (see Figure 5-5 on page 5-11) displays a single Performance tab. The
Performance tab has two areas: CPU Usage and Performance Logging.
CPU Usage
The CPU Usage area displays the following fields:
• CPU Busy%—Displays the percentage of CPU put to use for the selected GRP module.
• Average (1 min)—Displays the percentage of CPU being utilized averaged over a one minute period
for the selected GRP module.
• Average (5 min)—Displays the percentage of CPU being utilized averaged over five minute period
for the selected GRP module.
Performance Logging
The Performance Logging area allows you to start or stop performance logging.
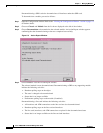
• Start—Click Start to enable performance logging for the selected GRP module. Enabling
performance logging allows performance data to be gathered for the selected module. Performance
polling occurs every 15 minutes. Performance data is then gathered and stored for historical review.
Current performance data can be viewed in the performance windows, or you can view historical
performance data in Performance Manager.
• Stop—Click Stop to stop all performance logging on the selected module. Disabling performance
logging stops performance data from being gathered for the selected GRP module.