


xStack
®
DGS-3400 Series Layer 2 Gigabit Ethernet Managed Switch
27
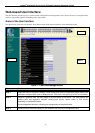
Web-based User Interface
The user interface provides access to various Switch configuration and management screens, allows the user to view performance
statistics, and permits graphical monitoring of the system status.
Areas of the User Interface
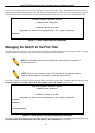
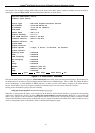
The figure below shows the user interface. Three distinct areas divide the user interface, as described in the table.
Figure 5 - 2 Main Web-Manager Screen
Area Function
Area 1
Select the menu or window to display. Open folders and click the hyperlinked menu buttons and
subfolders contained within them to display menus. Click the D-Link logo to go to the D-Link website.
Area 2
Presents a graphical near real-time image of the front panel of the Switch. This area displays the
Switch's ports and expansion modules, showing port activity, duplex mode, or flow control,
depending on the specified mode.
Some management functions, including port configuration are accessible here.
Area 3
Presents switch information based on user selection and the entry of configuration data.
Area 2
Area 1
Area 3