2680A/2686A
Getting Started Guide
56
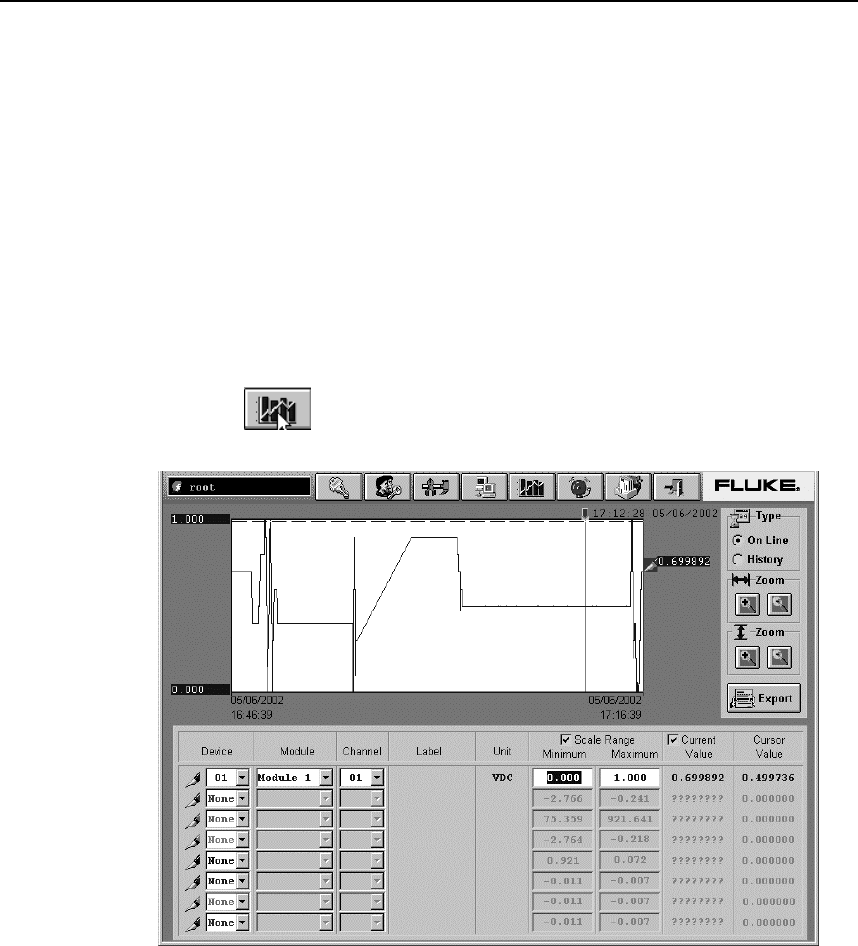
Using Trend to View Collected Data
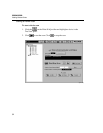
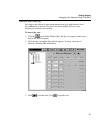
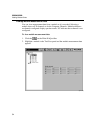
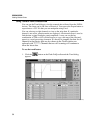
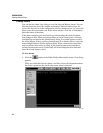
You can use the Trend dialog to view the scanned data collected from the 268XA
devices. The charts can be On Line or Historical. You can use the Export button to
export data to a CSV file that you can manipulate using Excel.
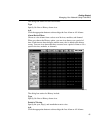
You can select up to eight channels to view on the strip chart. If a particular
channel is not active, question marks are displayed. A horizontal cursor is used to
find the time a signal reached a certain amplitude. A user can use the key
combination <CTRL><ALT><Print Screen> to copy a bit map of the chart and
paste it to a word processing document.
If a device is stopped, the data for all
channels in that device that are also shown in the Trend window are
replaced with ???????. Channels that are still scanning will continue to
show the latest data.
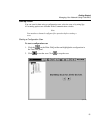
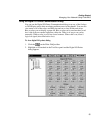
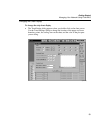
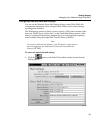
To use the trend feature
1. Click the
button on the Fluke DAQ toolbar and the Trend dialog
appears.
alg126.bmp


