


Statistics aplet 10-15
Two-variable
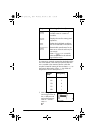
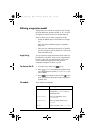
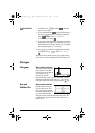
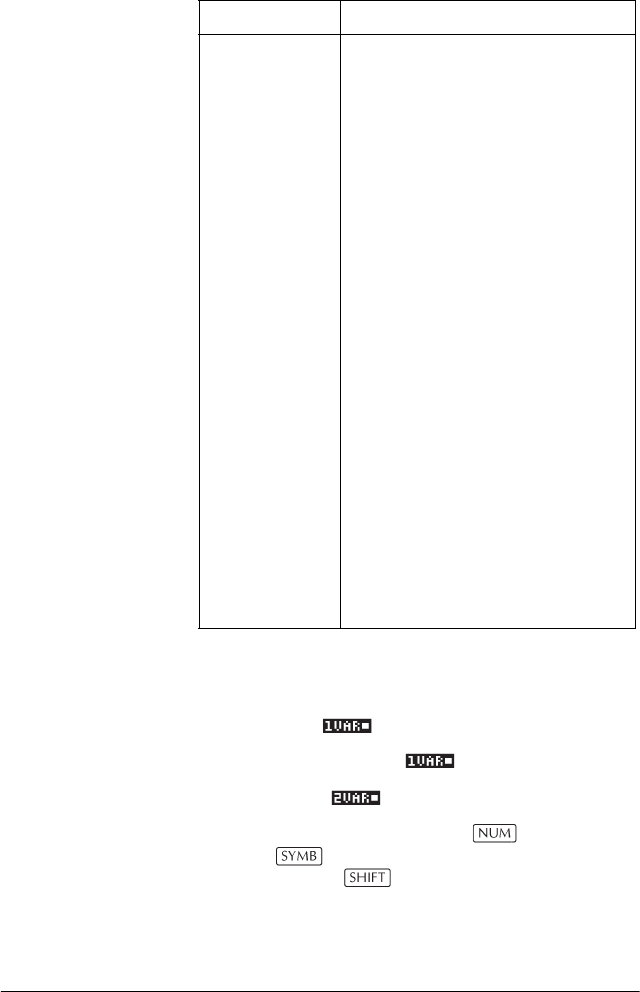
Plotting You can plot:
• histograms ( )
• box-and-whisker plots ( )
• scatter plots ( ).
Once you have entered your data ( ), defined your
data set ( ), and defined your Fit model for two-
variable statistics (
SETUP-SYMB), you can plot your
data. You can plot up to five scatter or box-and-whisker
plots at a time. You can plot only one histogram at a time.
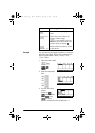
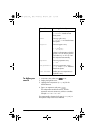
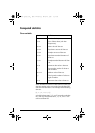
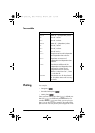
Statistic Definition
MEANX Mean of x- (independent) values.
ΣX Sum of x-values.
ΣX2 Sum of x
2
-values.
MEANY Mean of y- (dependent) values.
ΣY Sum of y-values.
ΣY2 Sum of y
2
-values.
ΣXY Sum of each xy.
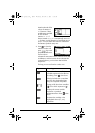
SCOV Sample covariance of independent
and dependent data columns.
PCOV Population covariance of
independent and dependent data
columns
CORR Correlation coefficient of the
independent and dependent data
columns for a linear fit only
(regardless of the Fit chosen).
Returns a value from 0 to 1, where
1 is the best fit.
RELERR The relative error for the selected
fit. Provides a measure of accuracy
for the fit.
HP 39gs English.book Page 15 Wednesday, December 7, 2005 11:24 PM