


80 Section 6: Statistics Functions
File name: hp 12c_user's guide_English_HDPMBF12E44 Page: 80 of 209
Printered Date: 2005/7/29 Dimension: 14.8 cm x 21 cm
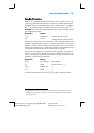
Linear Estimation
With two-variable statistical data accumulated in the statistics registers, you can
estimate a new y-value (
y
ˆ
) given a new x-value, and estimate a new x-value (
x
ˆ
)
given a new y-value.
To calculate
y
ˆ
:
1. Key in a new x-value.
2. Press gR.
To calculate
x
ˆ
:
1. Key in a new y-value.
2. Press gQ.
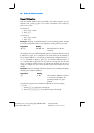
Example:
Using the accumulated statistics from the preceding problem, estimate
the amount of sales delivered by a new salesperson working 48 hours per week.
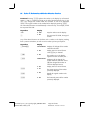
Keystrokes Display
48gQ
28,818.93
Estimated sales for a 48 hour
workweek.
The reliability of a linear estimate depends upon how closely the data pairs would,
if plotted on a graph, lie in a straight line. The usual measure of this reliability is
the correlation coefficient, r. This quantity is automatically calculated whenever
y
ˆ
or
x
ˆ
is calculated; to display it, press
~
. A correlation coefficient close to 1
or –1 indicates that the data pairs lie very close to a straight line. On the other
hand, a correlation coefficient close to 0 indicates that the data pairs do not lie
closely to a straight line; and a linear estimate using this data would not be very
reliable.
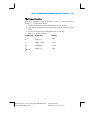
Example:
Check the reliability of the linear estimate in the preceding example by
displaying the correlation coefficient.
Keystrokes Display
~
0.90
The correlation coefficient is close to
1, so the sales calculated in the
preceding example is a good
estimate.
To graph the regression line, calculate the coefficients of the linear equation
y = A + Bx.
1. Press 0gR to compute the y-intercept (A).
2. Press 1gR~d~- to compute the slope of the line (B).