


Daytona Twin Tec LLC, 933 Beville Road, Suite 101-H, S. Daytona, FL 32119 TCFI Log
(386) 304-0700 www.daytona-twintec.com
3/2007
Page 4
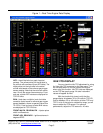
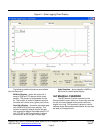
DATA LOGGING CHART DISPLAY
You can also display data logged by the TCFI
unit on a chart recorder type screen. Data logged by
the TCFI unit must be downloaded before it can be
displayed, by using the Download Data From TCFI
command on the Communications menu. Once data
has been downloaded, it is automatically displayed.
The last data logged will appear at the right end of
the chart. You can save the data by using the Save
File command from the File menu. You can display a
previously saved data file by first using the Open File
command on the File menu and then using the View
Chart command on the View menu.
Note that TCFI data files use a .log extension.
You should create a separate folder to store these
files.
You have a range of capabilities for analyzing
downloaded data displayed in the chart recorder
format. You can select two parameters for display.
Trace 1 is displayed in red with its Y axis legends on
the left side of the chart. Trace 2 is displayed in green
with its Y axis legends on the right side of the chart.
The X axis is always elapsed time. You can
select from one of three time scales. You can use the
scroll bar to move the chart display window in terms of
elapsed time. If you hold the left mouse button down
within the chart area, a cursor line appears. The exact
values of the parameters displayed on trace 1 and
trace 2 and the elapsed time appear in windows above
the chart. If you want to analyze the elapsed time
between two events (for example the time required to
accelerate from 0 to 60 MPH), you can move the
cursor to the first event and then click on the Reset
Time Display button. You can print the displayed chart
to any Windows printer by clicking on the Print button
(a color inkjet printer is recommended for best results).
Data parameters include:
RPM – engine crankshaft RPM
VSS – vehicle speed in MPH
MAP – manifold pressure in In-Hg (29.92 In-Hg
corresponds to atmospheric pressure)
TPS – throttle position (0 to 100%)
AFR – air/fuel ratio based on the exhaust gas
oxygen sensor reading (10:1 to 20:1). Front and
rear cylinder AFR values can be displayed for
data logged by TCFI IID units.
BLM – block learn multiplier (main fuel table
correction factor based on exhaust gas oxygen
sensor feedback, shown as percent value from
75-125%). Front and rear cylinder BLM values
can be displayed for data logged by TCFI IID
units.
IAC – idle air control stepper motor position
(higher number means more idle air)
IAT – intake air temperature (deg C)
ET – engine cylinder head temperature (deg C)
FRONT INJ, REAR INJ – injector pulse width in
milliseconds
FRONT ADV, REAR ADV – ignition advance in
degrees BTDC
BAT – battery voltage
USER – user output displayed as digital (on/off)
signal. On means that the output is grounded.
Additional data is displayed at the lower right
side of the screen. This data includes:
Baro – barometric pressure in In-Hg.
Diagnostic Code – normally blank unless a
diagnostic code is set. Refer to the TCFI
installation instructions for details.
Engine Status – based on engine temperature
and open/closed loop AFR
Log Interval – the actual data logging interval in
seconds
The TCFI data buffer stores the last 1600 data
points. With a nominal data logging interval of 0.50
seconds, this corresponds to 13.3 minutes of data. You
can set higher or lower data logging intervals by means
of the PC Link TCFI software Module Parameters
screen. Data logging intervals of 0.5-1.0 seconds are
suitable for on-road tests; a shorter interval of 0.10
seconds is recommended for dyno tuning.
You can clear the data within the TCFI by using
the Clear TCFI Data Buffer command from the
Communications menu. If you change the data logging
interval, you should also clear the TCFI data buffer.