


Chapter 5 Logging Data
© National Instruments Corporation 5-3 Getting Started with LabVIEW SignalExpress
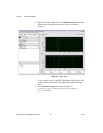
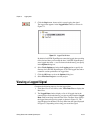
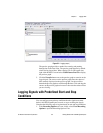
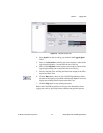
Figure 5-2. Logging.seproj
The preview graph provides a method for zooming and panning
through data in the Data View. The preview graph appears by default
when viewing logged data. When viewing live or non-logged data,
right-click the Data View and select Visible Items»Preview to display
the preview graph.
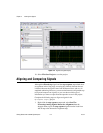
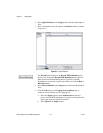
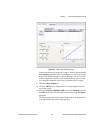
3. Click the Zoom In button next to the preview graph to zoom in on the
logged signal. The cursors on the preview graph show the subset of
data currently displayed on the preview graph. Use the scroll bar
beneath the preview graph to scroll through the data. Click and drag the
cursors on the preview graph to increase or decrease the subset of data
you are viewing.
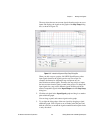
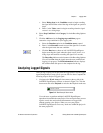
Logging Signals with Predefined Start and Stop
Conditions
You can configure start and stop conditions that the signals must meet
before LabVIEW SignalExpress records or stops recording the signals.
Complete the following steps to log data based on start and stop conditions.
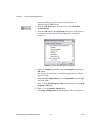
1. If the Recording Options tab is not visible, select View»Recording
Options to open the Recording Options View.