


EL-9650/9600c/9450/9400 Graphing Calculator
There may be differences in the results of calculations and graph plotting depending on the setting.
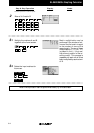
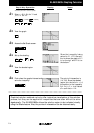
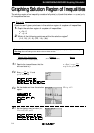
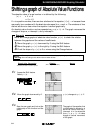
Return all settings to the default value and delete all data.
NotesStep & Key Operation
(When using EL-9650/9600c)
*Use either pen touch or cursor to operate.
Display
(When using EL-9650/9600c)
7-4
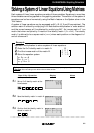
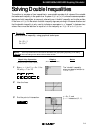
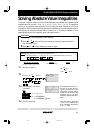
Graphing Solution Region of Inequalities
The solution region of an inequality consists of all points (a, b) such that when x = a, and y = b,
all inequalities are true.
Check to see if given points are in the solution region of a system of inequalities.
Example
1. Graph the solution region of a system of inequalities:
x + 2y
≤
1
x
2
+ y
≥
4
2. Which of the following points are within the solution region?
(-1.6, 1.8), (-2, -5), (2.8, -1.4), (-8,4)
1-1
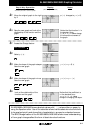
Rewrite the inequalities so that the
left-hand side is y.
x + 2y
≤
1 ➞ y
≤
x
2
+y
≥
4 ➞ y
≥
4 - x
2
1-x
2
*
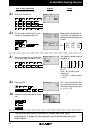
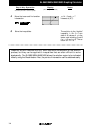
1-2
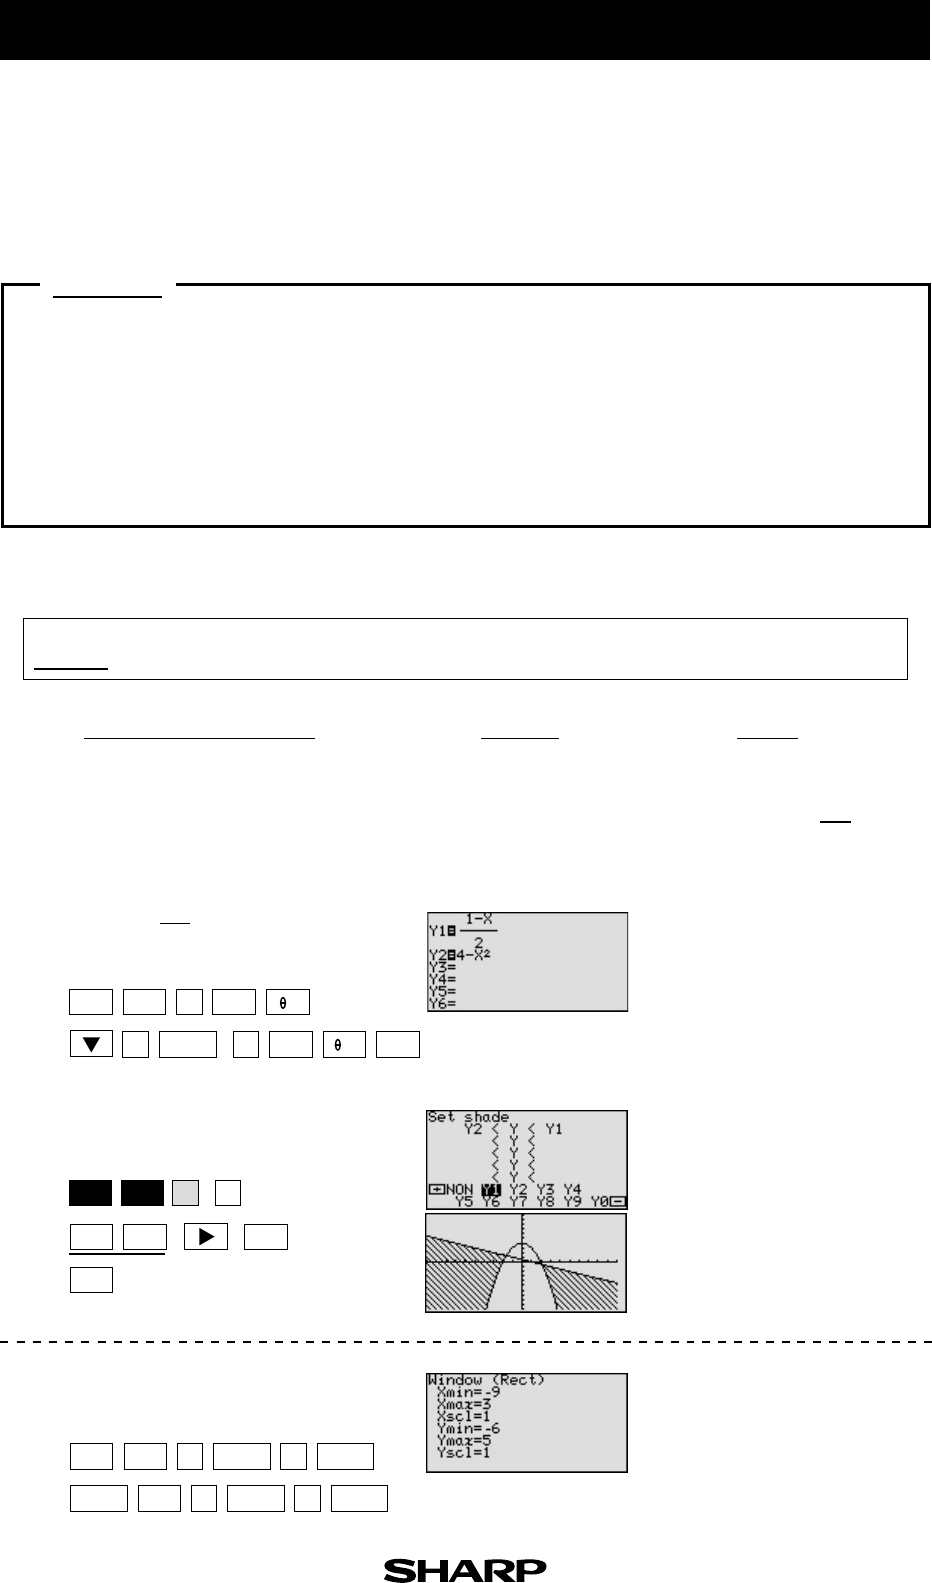
Enter y = for Y1 and
y = 4 - x
2
for Y2.
1-x
2
Set the shade and view the solution
region.
*
*
*
*
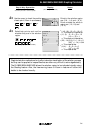
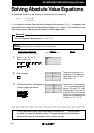
1-3
Y2
≤
y
≤
Y1
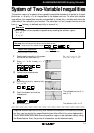
Set the display area (window) to :
-9 < x < 3, -6 < y < 5.
2-1
GRAPH
Y=
a
/b
1
24
G
1
93
65
ENTER
ENTER
ENTERENTER
ENTER ENTER
WINDOW
(
-
)
(
-
)
—— —
—
— x
2
2nd F
DRAW
X/
/T/n
X/
/T/n
Before
Starting