


EL-9650/9600c Graphing Calculator
8-1
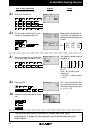
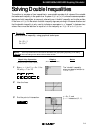
There may be differences in the results of calculations and graph plotting depending on the setting.
Return all settings to the default value and delete all data.
Set the zoom to the decimal window:
*
(
*
)
Notes
Step & Key Operation
*Use either pen touch or cursor to operate.
Display
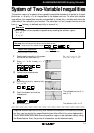
Slope and Intercept of Absolute Value Functions
The absolute value of a real number x is defined by the following:
|x| = x if x
≥
0
-x if x
≤
0
If n is a positive number, there are two solutions to the equation |f (x)| = n because there
are exactly two numbers with the absolute value equal to n: n and -n. The existence of two
distinct solutions is clear when the equation is solved graphically.
An absolute value function can be presented as y = a|x - h| + k. The graph moves as the
changes of slope a, x-intercept h, and y-intercept k.
Consider various absolute value functions and check the relation between the
graphs and the values of coefficients.
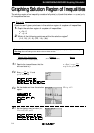
Example
1. Graph y = |x|
2. Graph y = |x -1| and y = |x|-1 using the Rapid Graph feature.
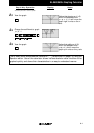
1-1
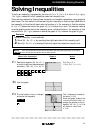
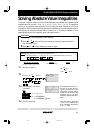
Enter the function y =|x| for Y1.
Notice that the domain of f(x)
= |x| is the set of all real num-
bers and the range is the set of
non-negative real numbers.
Notice also that the slope of the
graph is 1 in the range of X > 0
and -1 in the range of X
≤
0.
*
*
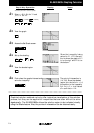
1-2
View the graph.
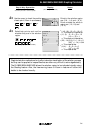
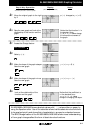
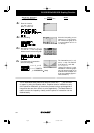
2-1
Enter the standard form of an abso-
lute value function for Y2 using the
Rapid Graph feature.
*
*
*
*
2-2
Substitute the coefficients to graph
y = |x - 1|.
ZOOM
ENTER 2nd F
A
7
Y=
Y=
ENTER
ENTER ENTER
ENTER ENTER
EZ
2nd F SUB
MATH
B
1
8
11
0
X/
/T/n
GRAPH
ENTER
Before
Starting