


3.2 Quick Start 3 Diagnostic Programs
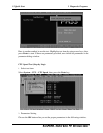
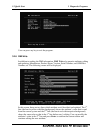
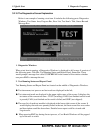
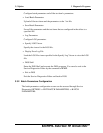
3.2.15 The Diagnostics Screen Explanation
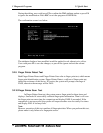
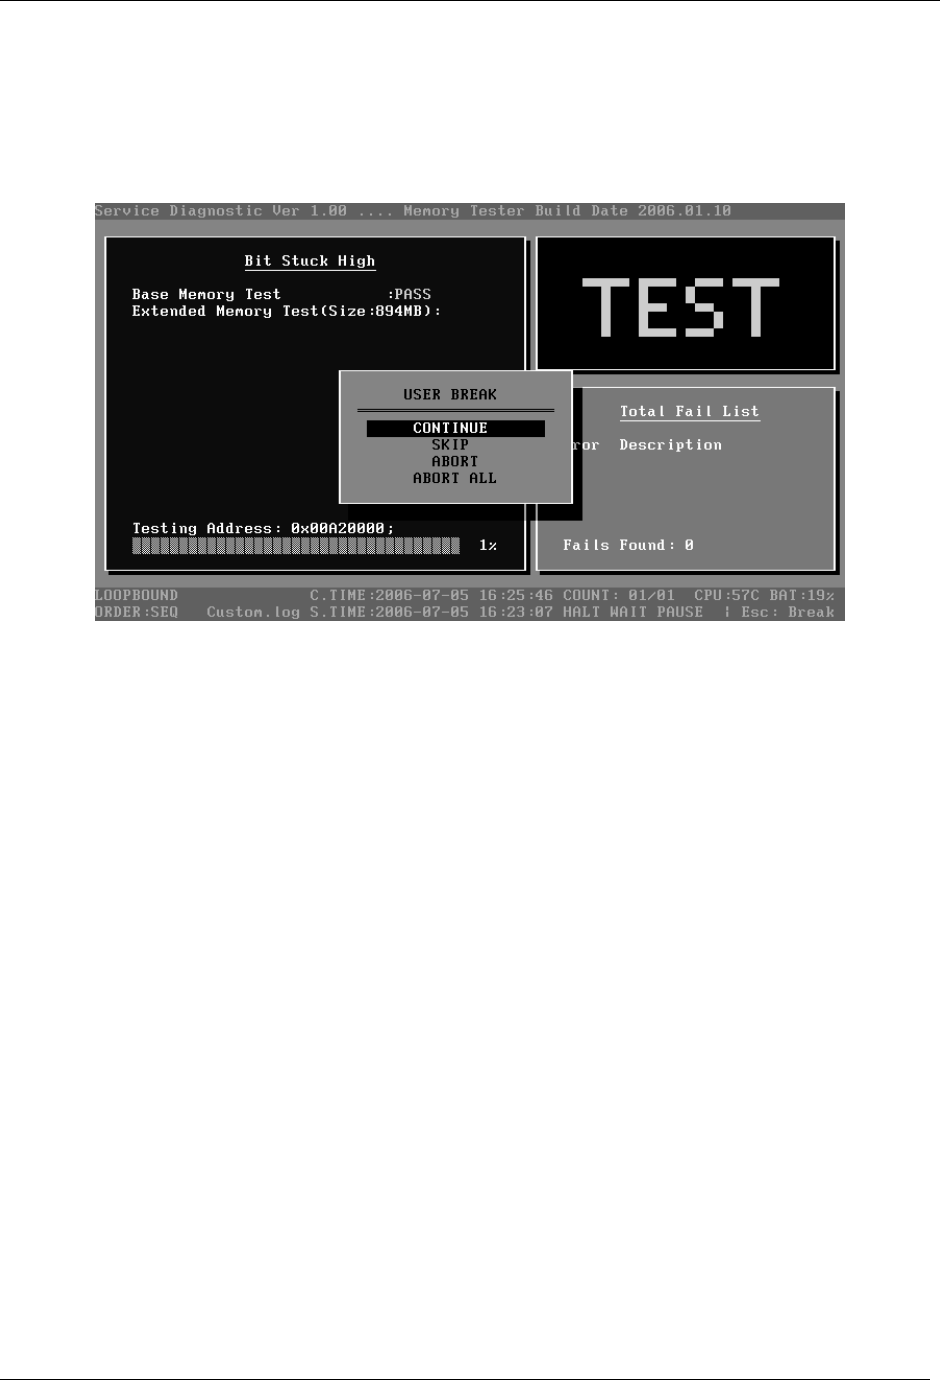
Below is an example of running a test item. It includes the following parts: Diagnostics
Windows, Test Status Area, Progress Bar, Error List, Test Item’s Title, Status Bar and
Message Box.
1. Diagnostics Windows
When a test item is running, a Diagnostics Windows is displayed in full screen. It consists of
the following parts: Title Bar, Test Running Status and Report Panel, Status Bar. There
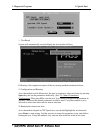
would prompt a message box called USER BREAK in the central of the window whether
user press ESC to interrupt the test.
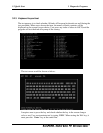
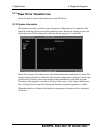
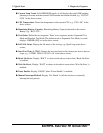
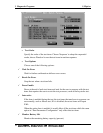
2. Test Running Status and Report Panel
Test Running Status and Report Panel are located on the middle of Diagnostics Windows.
Test item name, test process and test result are displayed in the left;
Test status and result are displayed in the upper right corner of the screen. It displays the
test status of the current test item – TEST (in testing), PASS (test finished and its result
is passed), FAIL (test finished and its result is failed) and SKIP (test skipped).
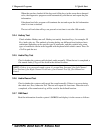
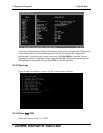
The error list of each test module is displayed at the lower right corner of the screen. It
would display the total error quantity found in the test, the most recent five error codes
and description would be shown here. Detailed error report could be viewed with
Logview.exe.
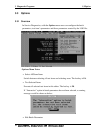
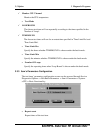
When pressing ESC key during the test process, a User Break Windows will be popped
up for the user to select.
QosmioF40/F45,dynabook Qosmio F40 Maintenance Manual
13