


Firmware Pages and Descriptions
58
TPI-PRO Total Presentation Interface - Pro Edition
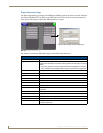
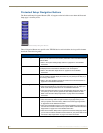
Protected Setup Navigation Buttons
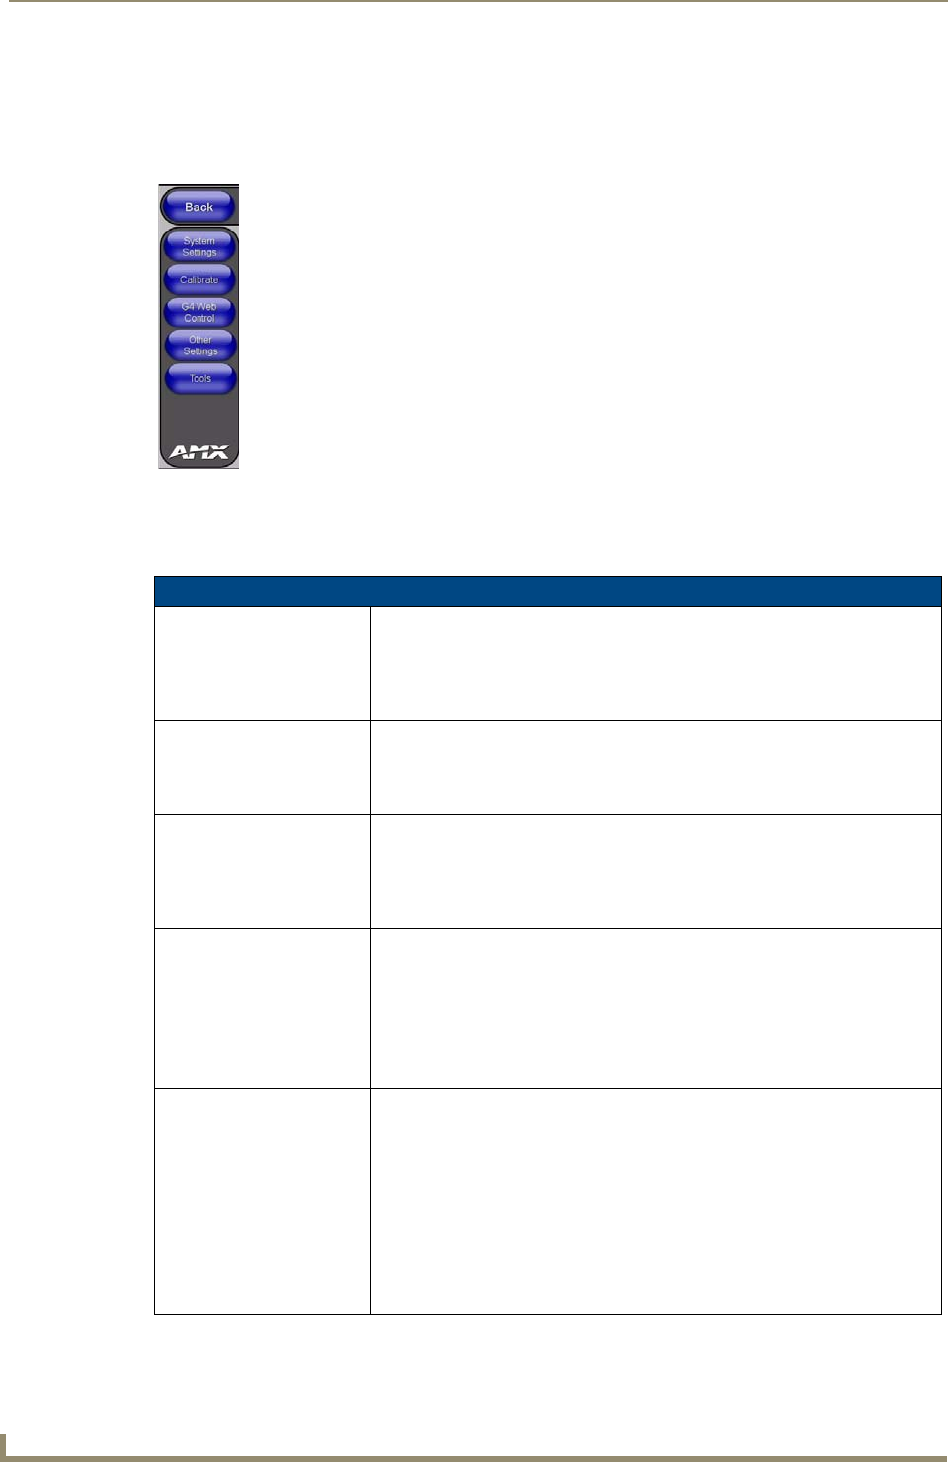
The Protected Setup Navigation Buttons (FIG. 42) appear on the left of the screen when the Protected
Setup page is currently active.
These Navigation Buttons are specific to the TPI-PRO device and include the device specific elements
described in the following table:
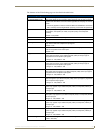
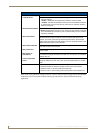
FIG. 42 G4 Protected Setup Navigation Buttons
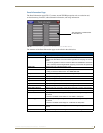
G4 Protected Setup Navigation Button Elements
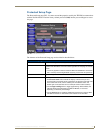
System Settings Press the System Connection button to access the System Settings page
where you can alter the communication parameters of both the NetLinx Master
and TPI-PRO.
• Refer to the System Settings Page section on page 64 for more detailed
information.
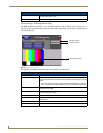
Calibrate Press the Calibrate button to access the Calibration page where you can use
the displayed set of crosshairs to calibrate a touch screen/panel.
• Refer to the Calibration Page section on page 63 for more detailed
information.
G4 Web Control Press the G4 Web Control button to access the G4 Web Control page where
you can enable or disable display and control of your panel (via the web) by a
PC running a VNC client.
• Refer to the Using G4 Web Control® to Interact with a G4 Panel section on
page 38 for more detailed information.
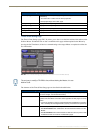
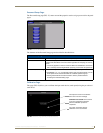
Other Settings Press the Other Settings button to open a slide bar with the following options:
• Press the Cache button to open the Cache page where you can adjust your
Flash Cache settings. Refer to the for more detailed information.
• Press the Passwords button to access the Password Setup page where you
can specify up to five security passwords The default password is 1988.
Refer to the
Password Setup Page section on page 63 for more detailed
information.
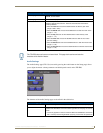
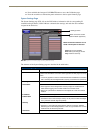
Tools Press the Tools button to open a slide bar with the following options:
• Press the Panel Logs button to open the Panel Logs page where you can
view your panel’s connection history. Refer to the
Panel Logs Page section
on page 68 for more detailed information.
• Press the Panel Statistics button to open the Panel Statistics page where you
can view the connection statistics for your panel. Refer to the
Panel Statistics
Page section on page 70 for more detailed information.
• Press the Connection Utility button to open the Connection Utility page where
you can view connection statistics and information for your panel. Refer to the
Connection Utility Page section on page 72 for more information.