


20010101
The following pages explain various statistical calculation methods based on the principles
described above. Details concerning statistical principles and terminology can be found in
any standard statistics textbook.
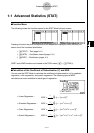
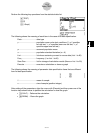
On the initial STAT Mode screen, press 3(TEST) to display the test menu, which contains
the following items.
• 3(TEST)b(Z) ... Z Tests (p. 1-2-2)
c(T) ... t Tests (p. 1-2-10)
d(χ
2
) ... χ
2
Test (p. 1-2-18)
e(F) ... 2-Sample F Test (p. 1-2-20)
f(ANOVA) ... ANOVA (p. 1-2-22)
kk
kk
k Z Tests
uu
uu
uZ Test Common Functions
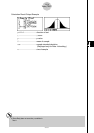
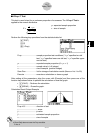
You can use the following graph analysis functions after drawing a graph.
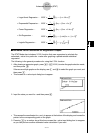
• 1(Z) ... Displays z score.
Pressing 1 (Z) displays the z score at the bottom of the display, and displays the pointer at
the corresponding location in the graph (unless the location is off the graph screen).
Tw o points are displayed in the case of a two-tail test. Use d and e to move the pointer.
Press i to clear the z score.
• 2(P) ... Displays p-value.
Pressing 2 (P) displays the p-value at the bottom of the display without displaying the
pointer.
Press i to clear the p-value.
uu
uu
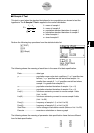
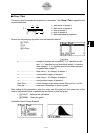
u1-Sample Z Test
This test is used when the population standard deviation is known to test the hypothesis. The
1-Sample Z Test is applied to the normal distribution.
Z =
o –
0
σ
µ
n
o : mean of sample
µ
o : assumed population mean
σ
: population standard deviation
n : size of sample
# The following V-Window settings are used for
drawing the graph.
Xmin = –3.2, Xmax = 3.2, Xscale = 1,
Ymin = –0.1, Ymax = 0.45, Yscale = 0.1
#Executing an analysis function automatically
stores the z and p values in alpha variables Z
and P, respectively.
1-2-2
Tests (TEST)
20011101