


20010101
kk
kk
k t Tests
uu
uu
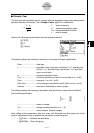
u t Test Common Functions
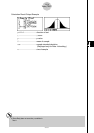
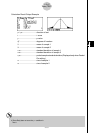
You can use the following graph analysis functions after drawing a graph.
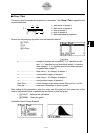
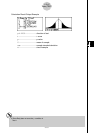
• 1(T) ... Displays t score.
Pressing 1 (T) displays the t score at the bottom of the display, and displays the pointer at the
corresponding location in the graph (unless the location is off the graph screen).
Tw o points are displayed in the case of a two-tail test. Use d and e to move the pointer.
Press i to clear the t score.
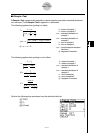
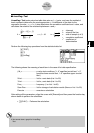
• 2(P) ... Displays p-value.
Pressing 2 (P) displays the p-value at the bottom of the display without displaying the pointer.
Press i to clear the p-value.
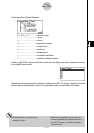
# The following V-Window settings are used for
drawing the graph.
Xmin = –3.2, Xmax = 3.2, Xscale = 1,
Ymin = –0.1, Ymax = 0.45, Yscale = 0.1
#Executing an analysis function automatically
stores the t and p values in alpha variables T
and P, respectively.
1-2-10
Tests (TEST)