


20010101
kk
kk
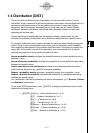
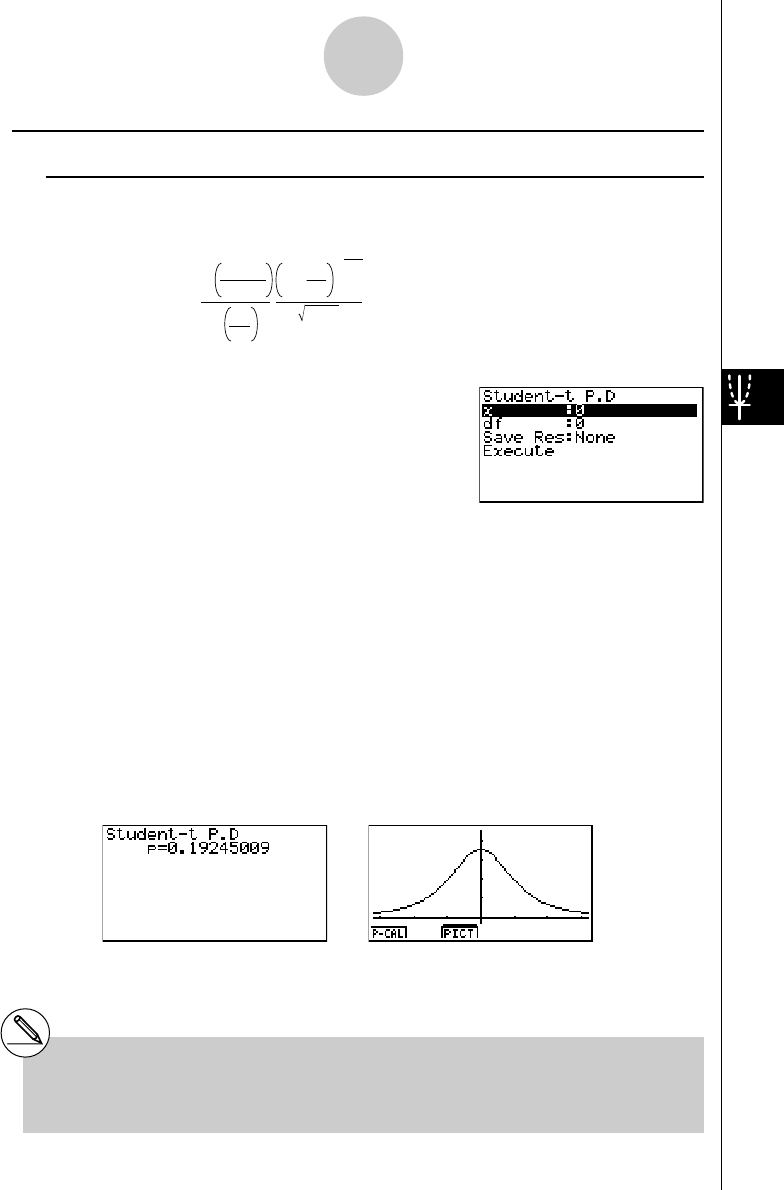
k Student-t Distribution
uu
uu
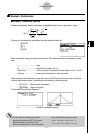
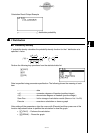
uStudent-t Probability Density
Student-t probability density calculates t probability density from a specified x value.
f
(x) =
Γ
Γ
df
π
–
df+1
2
2
df
2
df + 1
df
x
2
1+
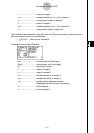
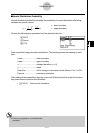
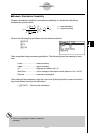
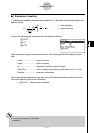
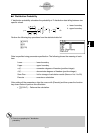
Perform the following key operations from the statistical data list.
5(DIST)
c(T)
b(P.D)
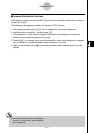
Data is specified using parameter specification. The following shows the meaning of each
item.
x .................................. data
df ................................. degrees of freedom (df > 0)
Save Res ..................... list for storage of calculation results (None or List 1 to 20)
Execute ....................... executes a calculation or draws a graph
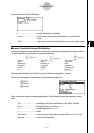
After setting all the parameters, align the cursor with [Execute] and then press one of the
function keys shown below to perform the calculation or draw the graph.
• 1(CALC) ... Performs the calculation.
• 6(DRAW) ... Draws the graph.
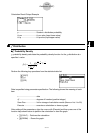
Calculation Result Output Example
p .................................. Student-t probability density
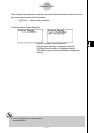
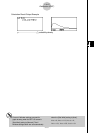
# Current V-Window settings are used for
graph drawing when the SET UP screen's
[Stat Wind] setting is [Manual]. The V-
Window settings below are set automatically
when the [Stat Wind] setting is [Auto].
Xmin = –3.2, Xmax = 3.2, Xscale = 1,
Ymin = –0.1, Ymax = 0.45, Yscale = 0.1
1-4-7
Distribution (DIST)
20011101