


4-26
Data Center High Availability Clusters Design Guide
OL-12518-01
Chapter 4 FCIP over IP/MPLS Core
Testing Scenarios and Results
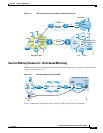
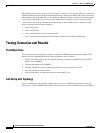
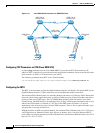
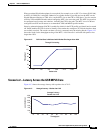
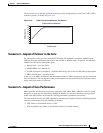
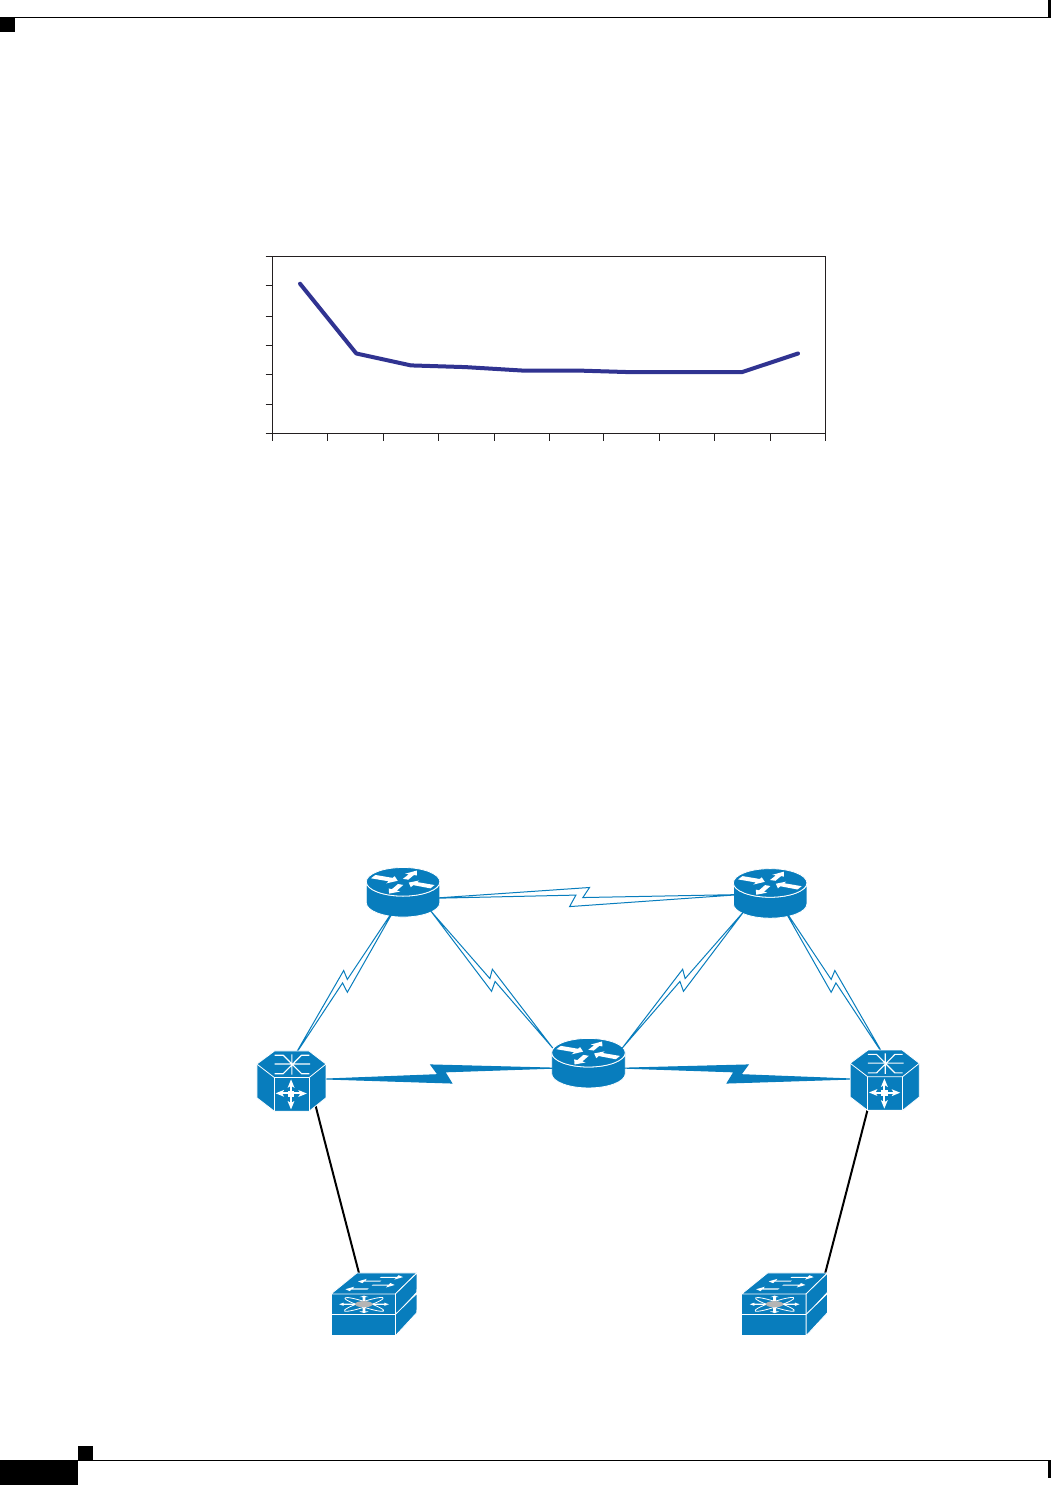
Figure 4-14 shows the average latency with packet size of 1024.
Figure 4-14 Average Latency—Packet size 1024
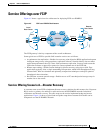
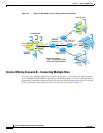
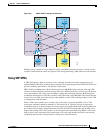
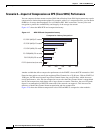
Scenario 3—Cisco MDS 9216i Connection to Cisco 7500 (PE)/GSR (P)
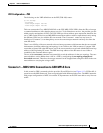
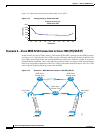
In this scenario, the Cisco 7500 is used as a PE and the FCIP traffic is passed over the GSR (P) routers
(see Figure 4-15). Typically, the Cisco 7500 is used as a PE router where traffic demand is minimal. The
Cisco 7500 cannot transport line rate for Gigabit Ethernet traffic and is limited to around 35 percent of
Gigabit Ethernet bandwidth. This is ideal when the customer traffic is compressed and the requirement
does not go beyond the capabilities of the Cisco 7500. As the traffic demand increases, the Cisco 7500
can be replaced by high performing routers like the GSR.
Figure 4-15 Scenario 3—MDS 9216i Connected to 7500 (PE)/GSR (P)
132433
0
200
400
600
800
1000
1200
10 20 30 40 50 60 70 80 90 100
Utilization
Latency (us)
Average Latency (us)
Packet size 1024
GSR 12410
Provider Core
GSR 12410
Provider Core
GSR 12410
Provider Core
Cisco 7500
PE
Cisco 7500
PE
132434
Gigabit Ethernet/POS/
Serial/DS3/DS1
Gigabit Ethernet/POS/
Serial/DS3/DS1
10.10.10.1
11.11.11.1