


Viewing FDDI Information 5-11
FDDI Management
Performance
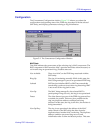
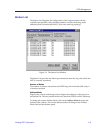
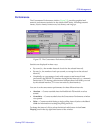
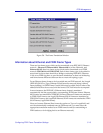
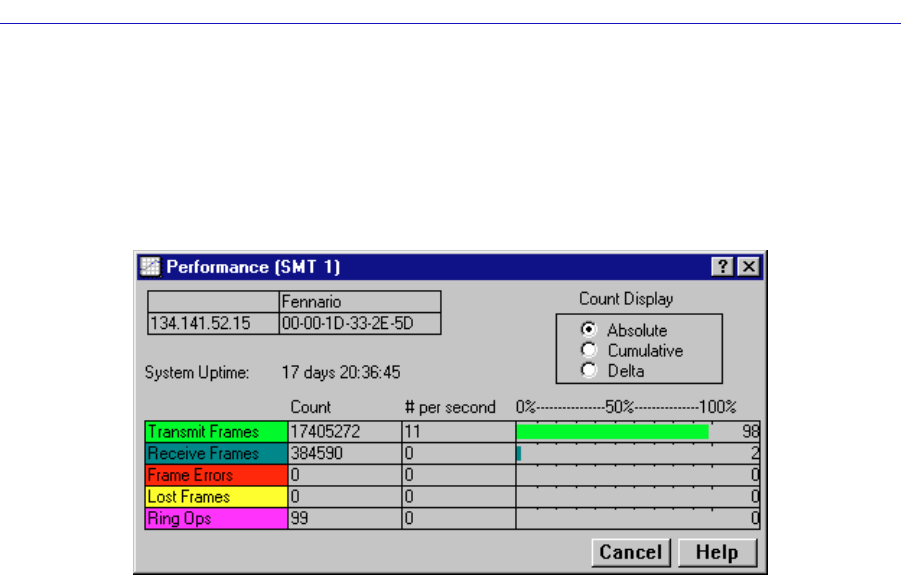
The Concentrator Performance window, Figure 5-5, provides graphical and
numeric performance statistics for the selected SMT entity, including transmit
frames, receive frames, frame errors, lost frames, and ring ops.
Figure 5-5. The Concentrator Performance Window
Statistics are displayed in three ways:
• By count (i.e., the number detected of each for the selected interval).
• By rate (i.e., the number of each per second, as averaged over the selected
interval).
• Graphically, as a percentage of each with respect to total network load
processed by the DELHF-UA interface during the last interval (e.g., a transmit
frames rate of 75% during a delta interval indicates that of all frames processed
by the selected interface, 75% were transmitted by that interface).
You can view the concentrator performance for three different intervals:
• Absolute — Counts recorded since the MultiSwitch 700 module was last
started.
• Cumulative — Counts recorded since the Concentrator Performance window
was opened.
• Delta — Counts recorded during a single polling interval (refer to the User’s
Guide for information on setting the polling interval).
To change the interval, click to select the desired radio button in the Count
Display panel in the top right hand corner of the window.