


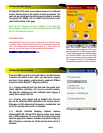
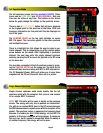
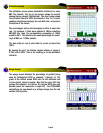
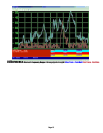

Utilization Screen
The utilization screen shows bandwidth utilization for every
802.11b channel. The top of the screen shows the current
channel being scanned (highlighted). The chart below shows
the utilization from 0 to 100% for channels 1 thru 14. It is color
coded to show the percentages for each data rate, as keyed on
the bottom of the screen.
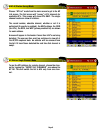
The percentages add up the throughput of data at each data
rate. For instance, if there were packets at 1Mb/s containing
500,000 bits, then the corresponding percentage at 1Mb/s
would be 50%. This would be the same percentage for receiv-
ing 5.5 Mb/s on 11 Mb/s packets.
The bars stack on top of each other to reveal no more than
100%.
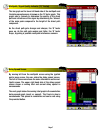
By tapping the grid, the display toggles between a range of
0-10% and 0-100%. This is for zooming in on low-utilization
statistics.
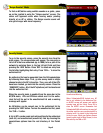
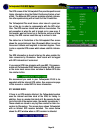
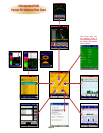
Usage Screen
The usage screen displays the percentage of packets being
seen by Yellowjacket PLUS in channels 1 through 14. The
graph at the bottom shows RSSI bars for APs detected and
is arranged by channel number. Note that the more APs that
occupy each channel, the thinner the vertical RSSI bars will
become (each bar represents a single AP). The PER/USAGE
calculations are now based on a rolling average over the last
number (1024) points.
Page 9