WAN Top Talkers
Chapter 5 Using Observer with a WAN Probe
86
rev. 1
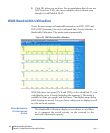
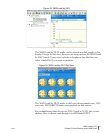
Figure 57 WAN Load by DLCI Graph View
The WAN Load display in graph view shows these same statistics
(transfer rate, CRC error rate, and FECN/BECN frame rates) as
superimposed spike meters. The Committed Information Rate (CIR)
is also shown, allowing you to view the network activity against the
baseline performance you have contracted to receive from your WAN
service provider
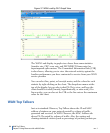
You can select line, point, or bar-style meter, and the colors for each
statistic by right-clicking on the chart. The dropdown menus at the
top of the display let you select what DLCIs to view, and how the
chart should be scaled (linearly, logarithmically, or auto-scale). For
linear scales, you can also set the CIR or the line rate as the maximum
value for the chart.
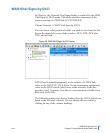
WAN Top Talkers
Just as in standard Observer, Top Talkers shows the IP and MAC
address of stations on your network sorted by volume of traffic
generated and received. In WAN Observer, the MAC Address tab
shows DLCIs sorted by volume of traffic. Also, the sorting and
charting statistical criteria (such as percentage of packets, packets per


