4. Monitoring
8335-A2-GB20-70 February 2003 4-7
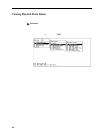
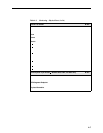
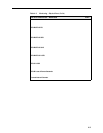
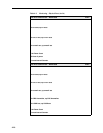
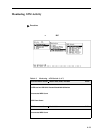
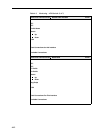
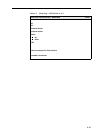
DSL Link Performance Summary Screen – Model 8365 B-B-D
Shows performance statistics for the DSL link at the physical layer.
Enter a port name (dsl1–dsl12) to see current statistics.
CPE Vendor ID
–
The manufacturer of the endpoint.
Latency
–
The channel used by the data stream, either Interleave or Fast path.
Line Code
–
The line code selected for the port either DMT, G.Lite, or ANSI.
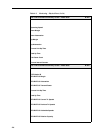
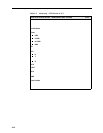
Card Up Time – The amount of time since the line card was last reset, in days, hours,
minutes, and seconds.
Percent Link Up – The percentage of time the link has been up relative to the line card.
Operating Speeds
–
The DSL line speed in kbps for the downstream and upstream data
paths.
Down Margin – The margin reported by the endpoint, in dB. The larger the number, the
higher the link’s tolerance to noise.
Down Attenuation – The signal attenuation reported by the endpoint, in dB. Generally,
the larger the number, the longer the loop.
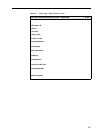
Up Margin – The margin detected by the line card, in dB. The larger the number, the
higher the link’s tolerance to noise.
Up Attenuation – The signal attenuation detected by the line card, in dB. Generally, the
larger the number, the longer the loop.
Current Link Up Time – The amount of time since the link became operational, in days,
hours, minutes, and seconds.
Attainable Speeds
–
The attainable DSL line speed in kbps for the downstream and
upstream data paths, based on the target margin selected and the Signal to Noise Ratio
calculated at startup.
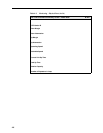
Relative Capacity
–
The operating speed relative to the attainable speed expressed as a
percentage for the downstream and upstream data paths.
Table 4-2. Monitoring – Physical Ports (3 of 6)


