


Viewing Patient Data
Trends and Calculations 8-3
Trends and
Calculations
Viewing Patient Data
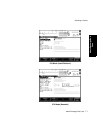
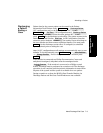
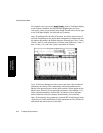
There are two ways to view patient data:
In either form, the most recent data is displayed at the right of the screen
(unless entered through the Graph Trends where you may have moved
the time bar). The patient data will be presented in the default resolution
(level of detail) and time span.
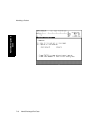
The number of parameters available to be viewed depends on the patient
data management configuration and the options purchased. Data is stored
and appears in tables and graphs (if configured) even though the numeric
is not displayed on the Main Screen.
The number of parameters tracked, the frequency of measurement
capture, and the number of hours of database storage are determined in
configuration mode prior to monitor use. The combinations are:
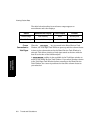
Standard Database
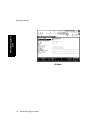
In graphs where parameter values are points plotted on a graph
along a time axis
In tables where parameter values and the times the values were
collected are listed in a table
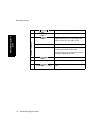
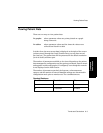
No. of Parameters Resolution Size
16 1 minute 24 hours
16 12 seconds 4 hours