SPRAA56
14 DSP/BIOS Real-Time Analysis (RTA) and Debugging Applied to a Video Application
last30frame.current = CLK_getltime();
// check to see if we dropped any frames
benchVid.framesDropped.current = last30frame.current - last30frame.previous;
benchVid.framesDropped.current -= 1000*(frameCnt / DISPLAYRATE);
benchVid.framesDropped.current /= DISPLAYRATE;
last30frame.previous = last30frame.current;
if (benchVid.framesDropped.current > 0 && frameRateTarget == DISPLAYRATE ) {
LOG_error("Dropped %d frames", benchVid.framesDropped.current);
UTL_logDebug2("Dropped %d frames, after %d frameCount",
benchVid.framesDropped.current, frameProcessCnt);
benchVid.framesDropped.previous = benchVid.framesDropped.current;
if (benchVid.framesDropped.current > benchVid.framesDropped.max) {
benchVid.framesDropped.max = benchVid.framesDropped.current;
}
} // end of dropped frame detection
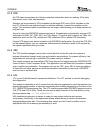
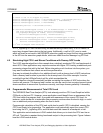
A UTL_logDebug API call is made during the benchmarking routine every 30 or 25 frames, to
report any dropped frames during the last group. Additionally, a call to LOG_error is made,
which will insert a red mark in the DSP/BIOS execution graph and insert the text string specified
in the API into the execution graph details, which are visible from the Message Log RTA tool.
4.5 Simulating High CPU Load Stress Conditions with Dummy NOP Loads
The H.263 encoder algorithm in this example has a relatively moderate CPU load benchmark of
about 50%. Other applications may require encoders with higher CPU loading or additional post-
processing stages that add to the load. Before integrating such functions into the system, you
may want to estimate their effects on real-time performance.
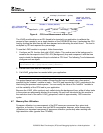
One way to estimate the effects of an additional load is with a dummy load of NOP instructions.
Such a dummy load function is provided in the dummyLoad.c file of this example. It can be
controlled from the h263rateControl.gel file, which manipulates the
controlVideoProc.dummyProcessLoad variable containing the number of NOP instructions the
function will execute. The dummy load function can also be used to test a system beyond typical
stress conditions to ensure that it performs correctly, and drops frames gracefully if necessary.
4.6 Programmatic Measurement of Total CPU Load
The DSP/BIOS Real-Time Analysis (RTA) tools already provide a CPU Load Graph tool within
CCStudio on the host PC. However, some applications could benefit from an awareness of the
CPU load within the program itself. A program with awareness of the current CPU load, for
instance, could decide not to instantiate new processing routines when the load is high, or could
turn on additional post-processing when the load is lower.
Programmatic calculation of the CPU load could also be useful if RTA is disabled, causing the
CPU Load Graph to be inoperative. The application could periodically report the current CPU
load using the UTL_logDebug APIs, and that data could be viewed at a breakpoint or halt.
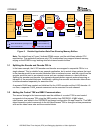
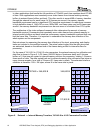
This application note introduces a LOAD module that allows you to check the CPU load via an
API call. That data is reported during benchmark output in the processing task. Figure 4 shows
how the LOAD module works.


