Op eration & S tatus
Restore Factory Defaults
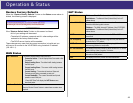
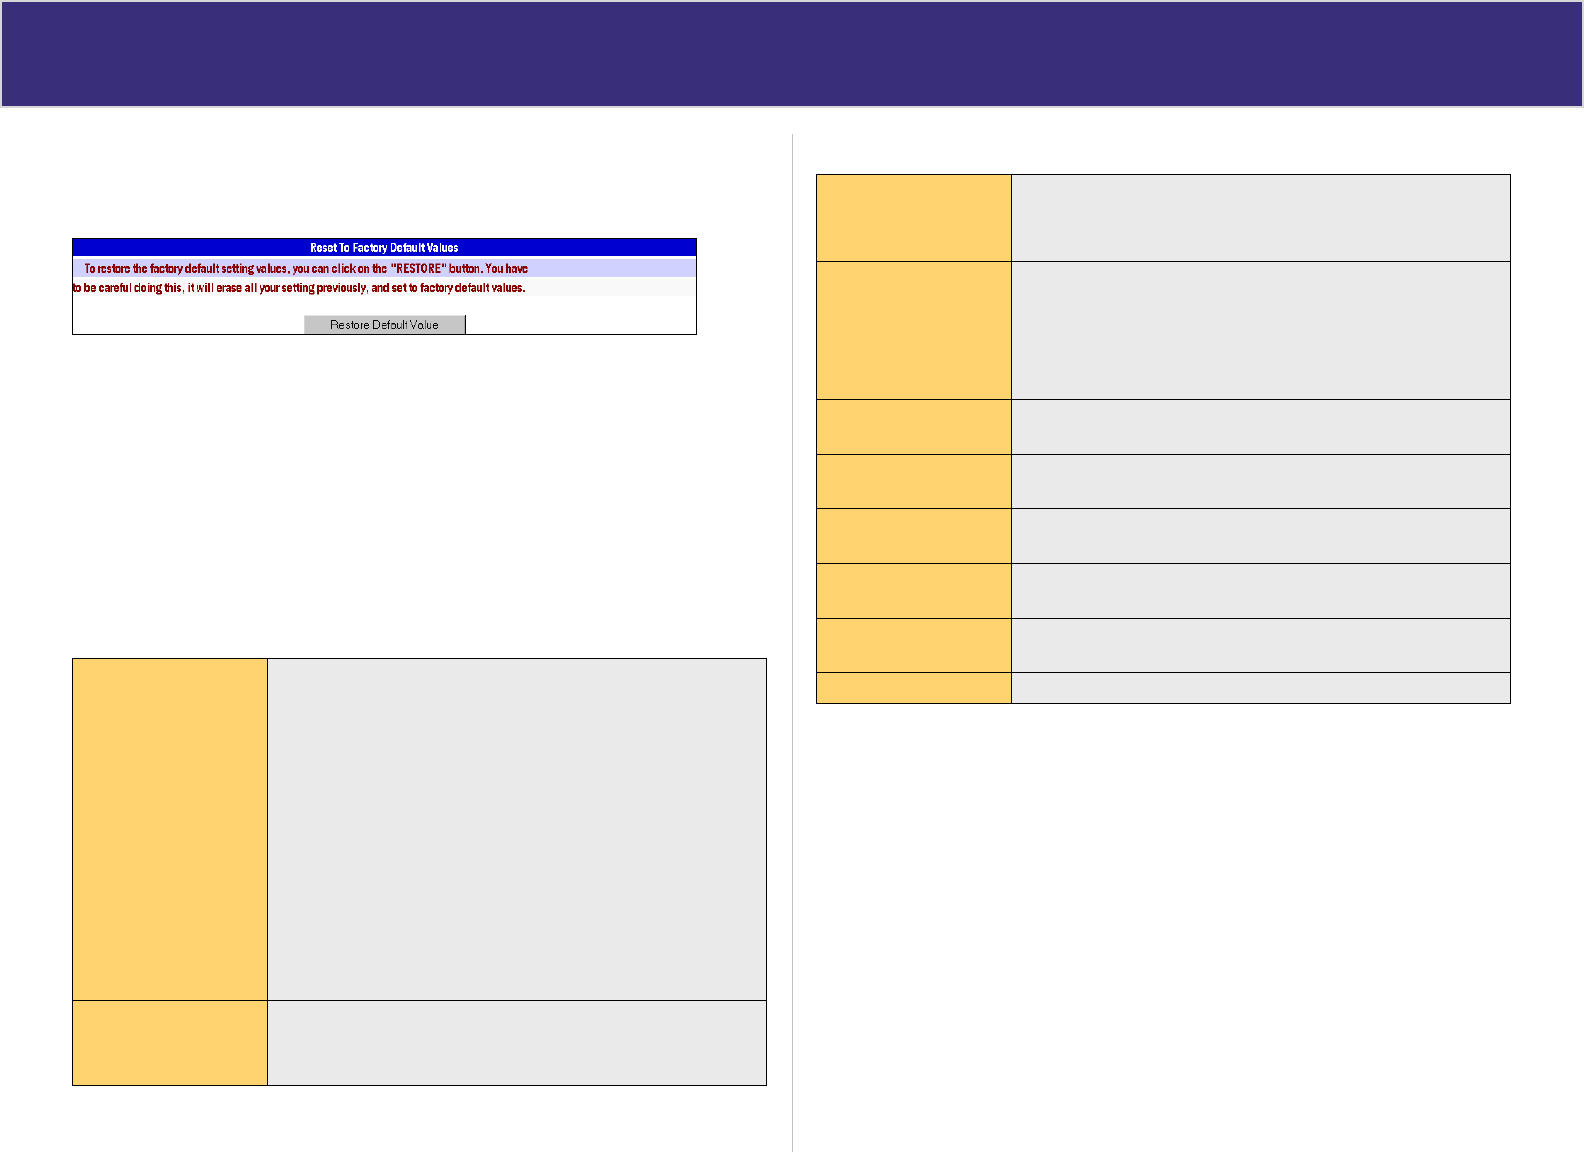
When the “Restore Factory Defaults” button on the Status screen above is
clicked, the following screen is displayed.
If the “Restore Default Value” button on this screen is clicked:
• ALL of your settings will be erased.
• The default IP address, password and ALL other settings will be
restored to the factory default values.
• The DCHP server function will be enabled.
These changes may mean that the current connection is invalid and you
will have to re-connect to the XC-DPG602 using its default IP address
(192.168.1.1).
WAN Status
NAT Statistics This section displays data for each WAN port.
Connection status – This will display either Connected or Not
Connected.
Default Loading Share - The default traffic loading between
the WAN ports.
Current Loading Share – The current traffic loading between
the WAN ports.
Current Loading – The number of sessions, Bytes and
Packets currently being processed on each port.
Current Bandwidth – The current Download and Upload
speeds on each WAN port.
“Check NAT Detail” will display the NAT Status screen,
described below.
Interface Statistics This section displays cumulative statistics.
Use the “Restart Counter” button to restart these counters when
required.
NAT Status
LAN IP Info
IP Address – The LAN IP Address of the XC-DPG602.
Mask Address – The Network Mask (Subnet Mask) for the IP
Address above.
Active WAN IP Info There is one (1) row for each active connection. For each
connection the following data is shown:
IP Address – The WAN (Internet) IP Address of the XC-DPG602.
Mask Address – The Network Mask (Subnet Mask) for the IP
Address above
NAT Timeouts This displays the current timeout values for TCP and UDP
connections.
TCP Prosperity This displays the MSS (Maximum Segment Size) and Maximum
Windows size for TCP packets.
NAT Traffic This section displays statistics for both outgoing (LAN to Internet)
and Incoming (Internet to Local) traffic.
NAT Connections This displays the current number of active connections. For further
details, click the “View Connection” list button.
Errors Statistics are displayed for Checksum errors, number of retries,
and number of bad packets.
Misc. This displays the total IP packets and reserved address.
44


